Original field study · 10 real roofs · New Zealand + United States
We completed 10 roof takeoffs remotely using freely available aerial imagery, Street View/side imagery for pitch estimation, and QuoteCore+'s free digital takeoff tool. We then physically measured the same roofs on site and compared every roof area, roof pitch (slope) and individual roof component.
The field checks were completed in New Zealand and the United States, but the workflow itself can be used anywhere sufficiently clear satellite, aerial or map imagery is available - including the UK, Australia and Canada.
Internal QuoteCore+ field study · 10 accessible residential roofs · digital measurements frozen before site verification · travel time excluded.
3.52%
Average absolute roof-area error
9 of 10 roof areas were within 5%. All 10 were within 10%.
83.8%
of 136 component measurements within 5%
94.9% were within 10%. Median absolute component error: 1.94%.
1.6°
Average absolute pitch difference
8 of 10 were within 2°. Every pitch estimate was within 3° in this test.
71.1%
Less measuring time
27:09 digital vs 94:06 physically on site - before any travel time is added.
Across 10 real roofs, remote satellite/aerial roof takeoffs produced roof-area measurements averaging 3.52% absolute error compared with physical site measurements. 9 of 10 roof areas were within 5%, and all 10 were within 10%. Across 136 individual roof-component measurements, 83.8% were within 5% and 94.9% were within 10%. Remote pitch estimates averaged 1.6° from the real pitch, while digital takeoffs required 71.1% less measuring time - before travel time was included.
Watch the study: 10 roofs, every measurement compared
01
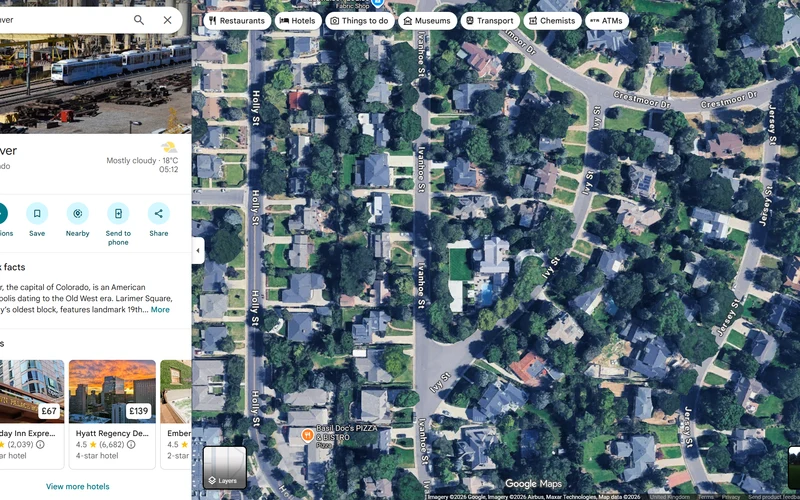
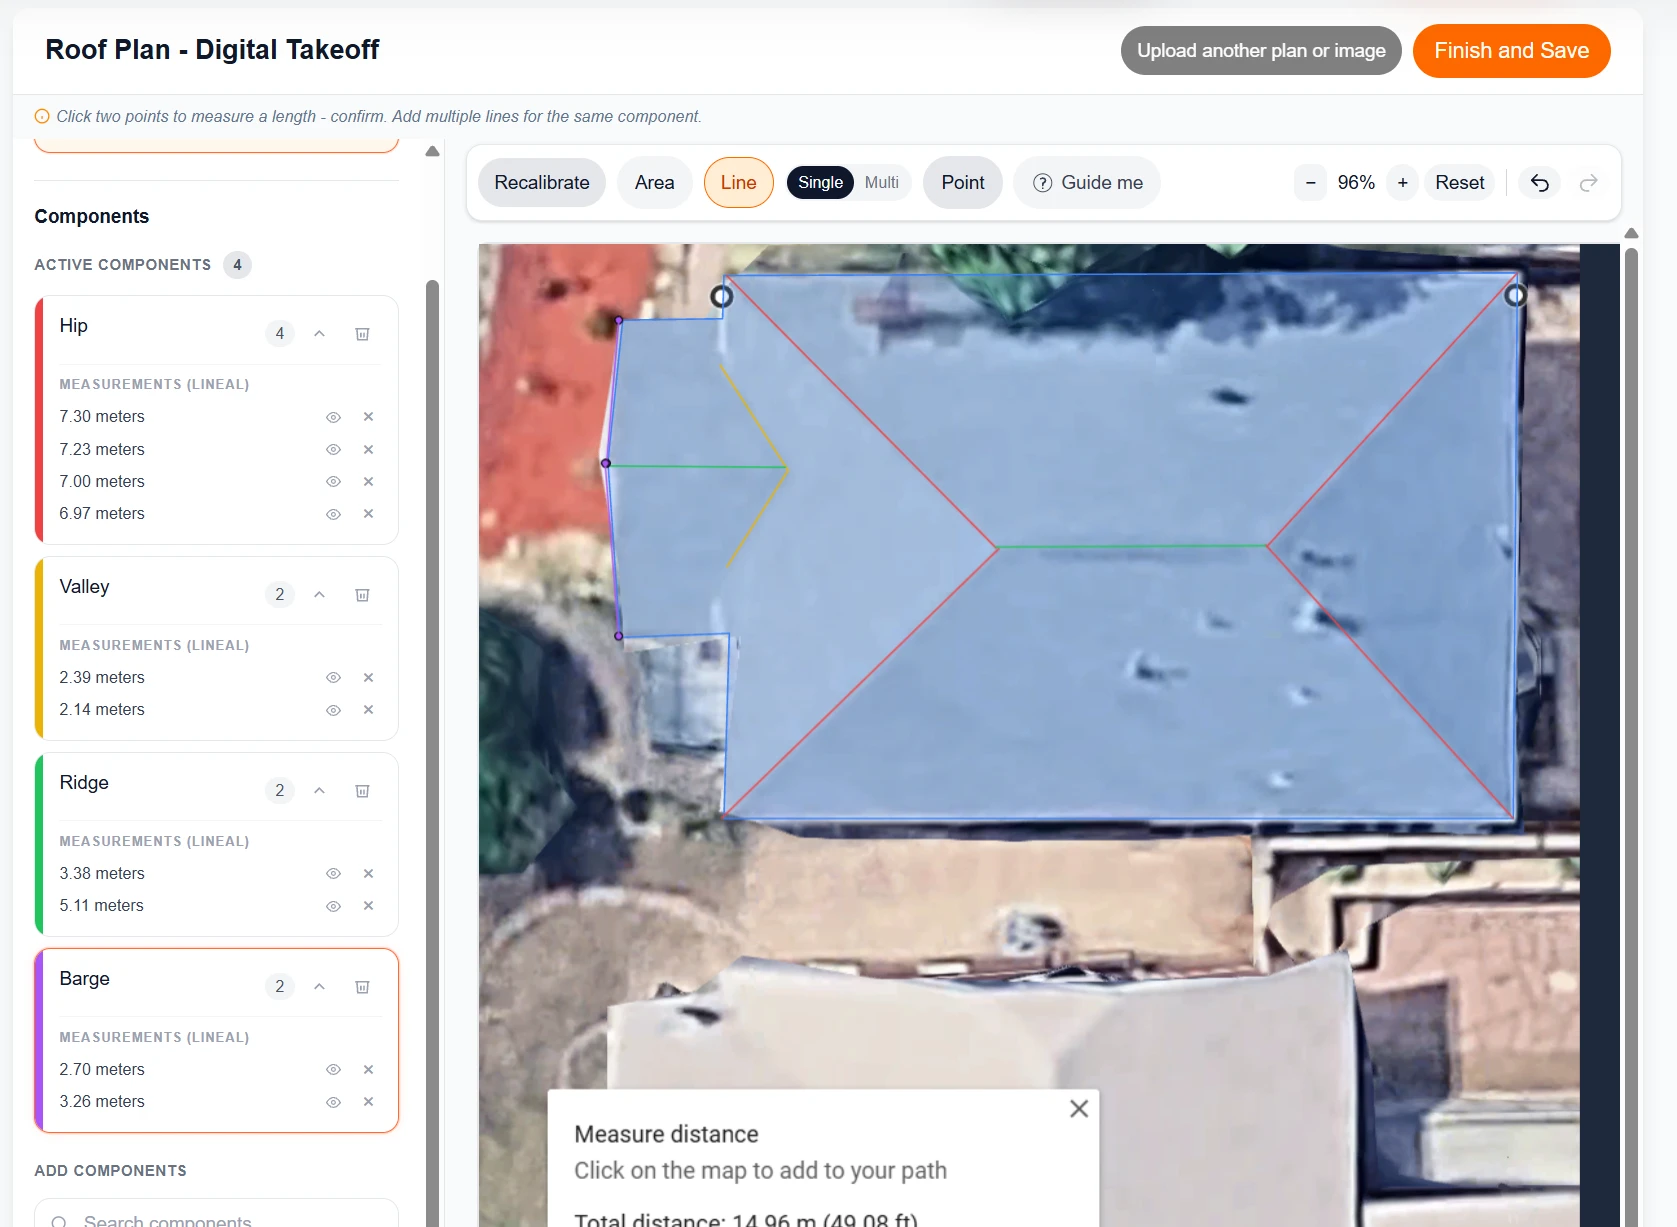
Top-down aerial imagery used to create the remote roof plan.
02
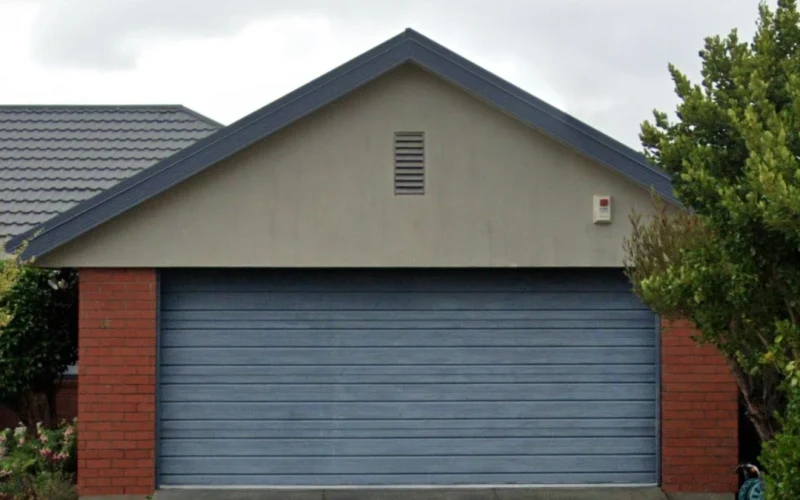
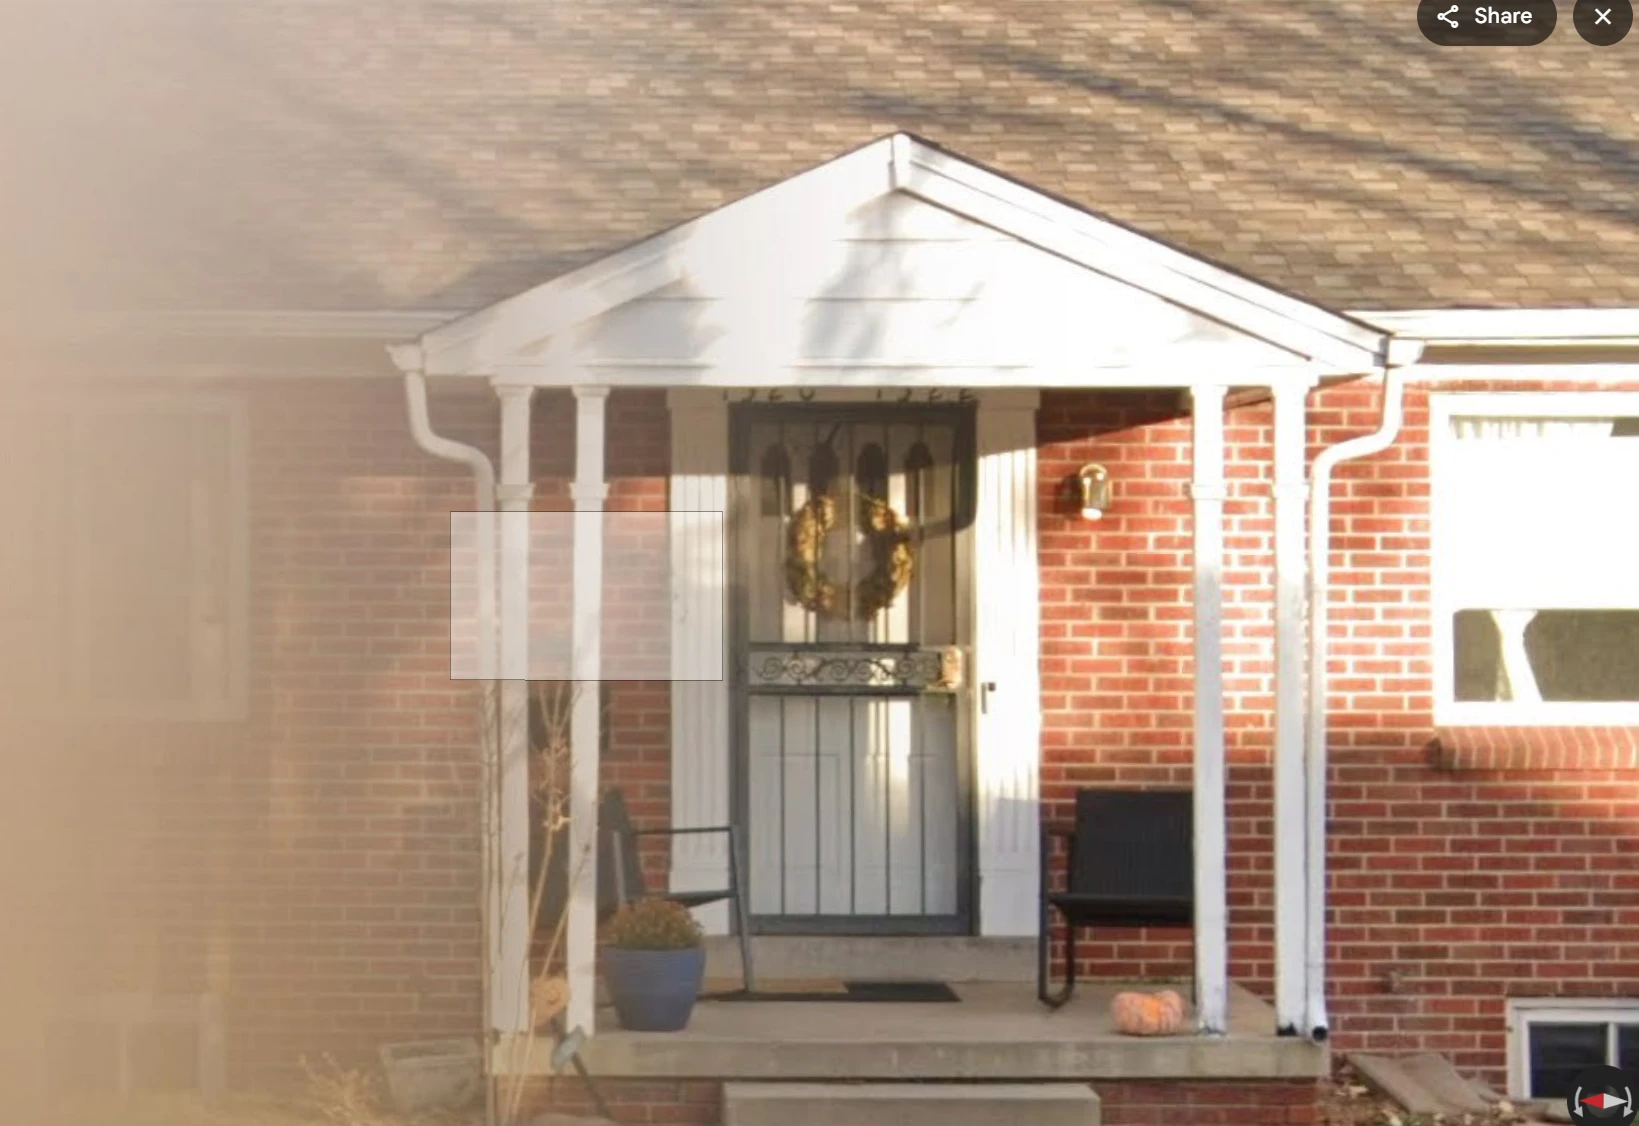
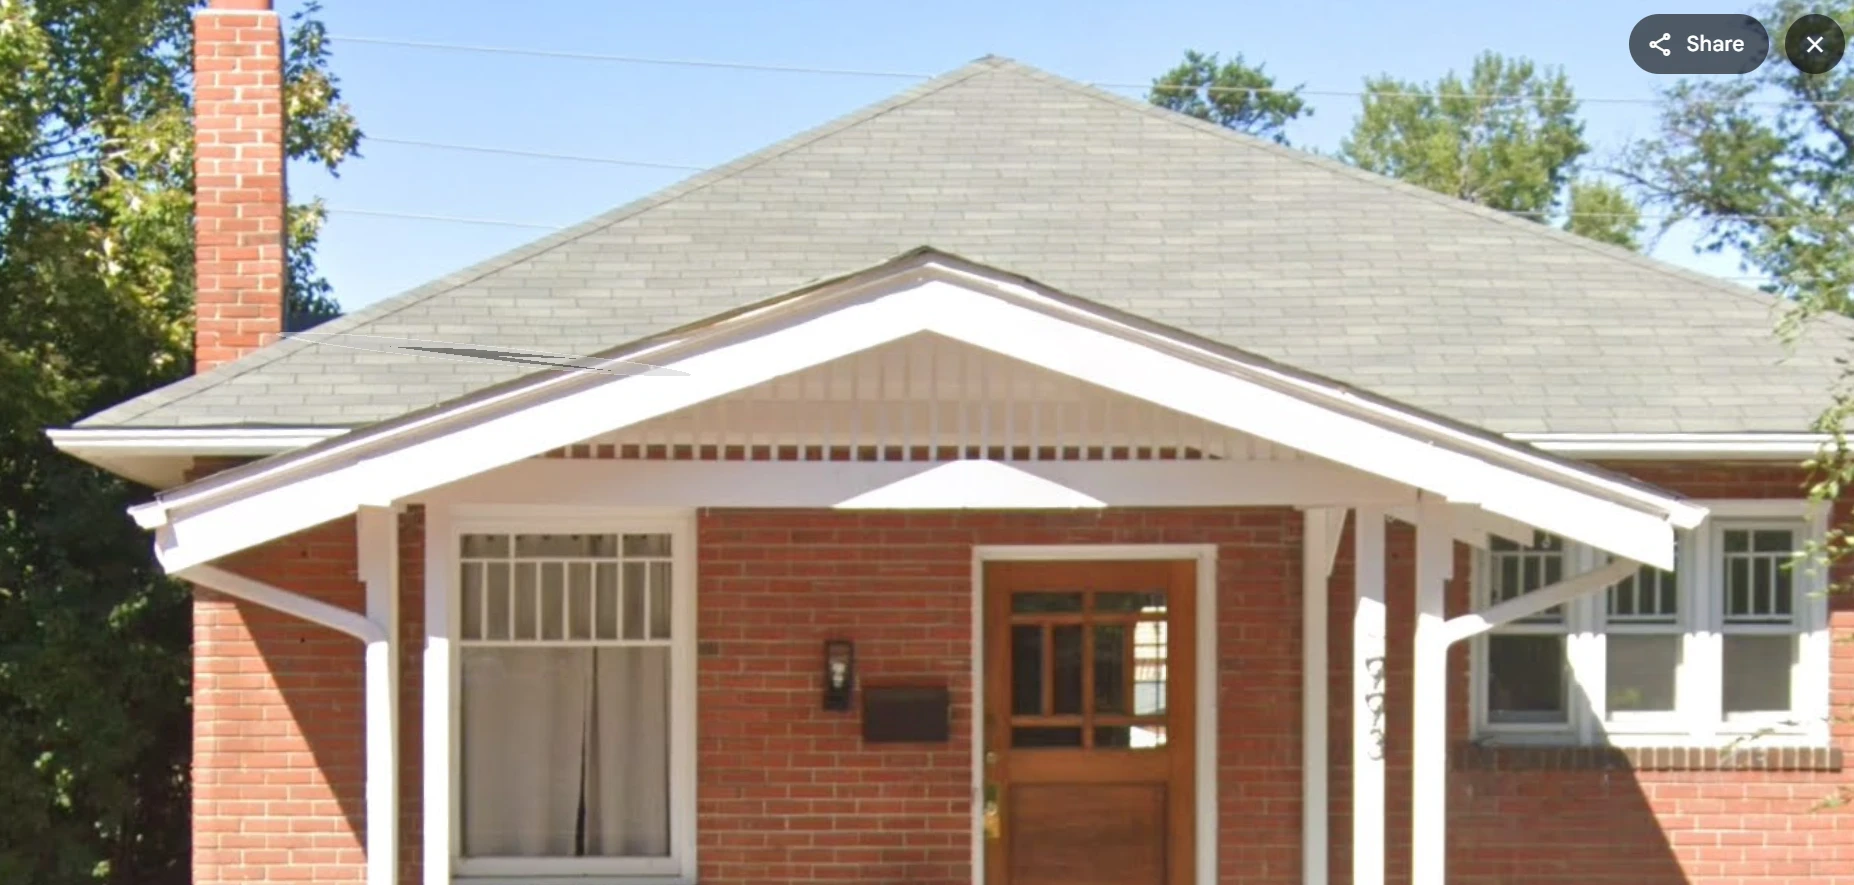
Available Street View / side / 3D imagery used with QuoteCore+'s Pitch Finder to estimate roof pitch (roof slope).
03
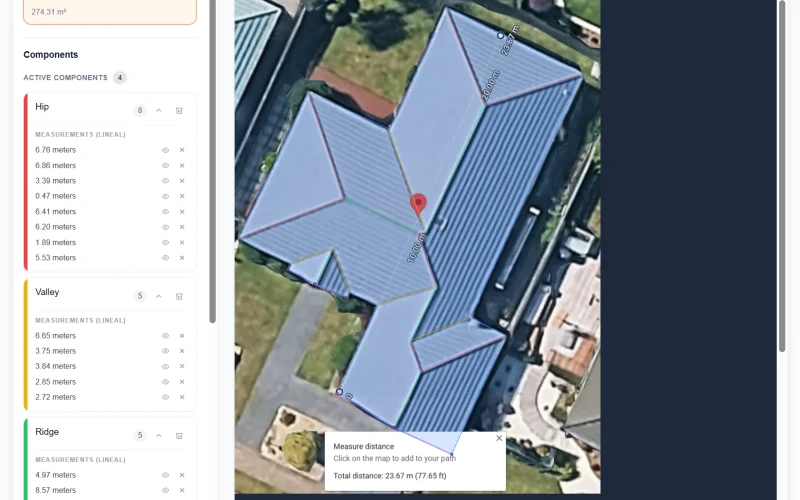
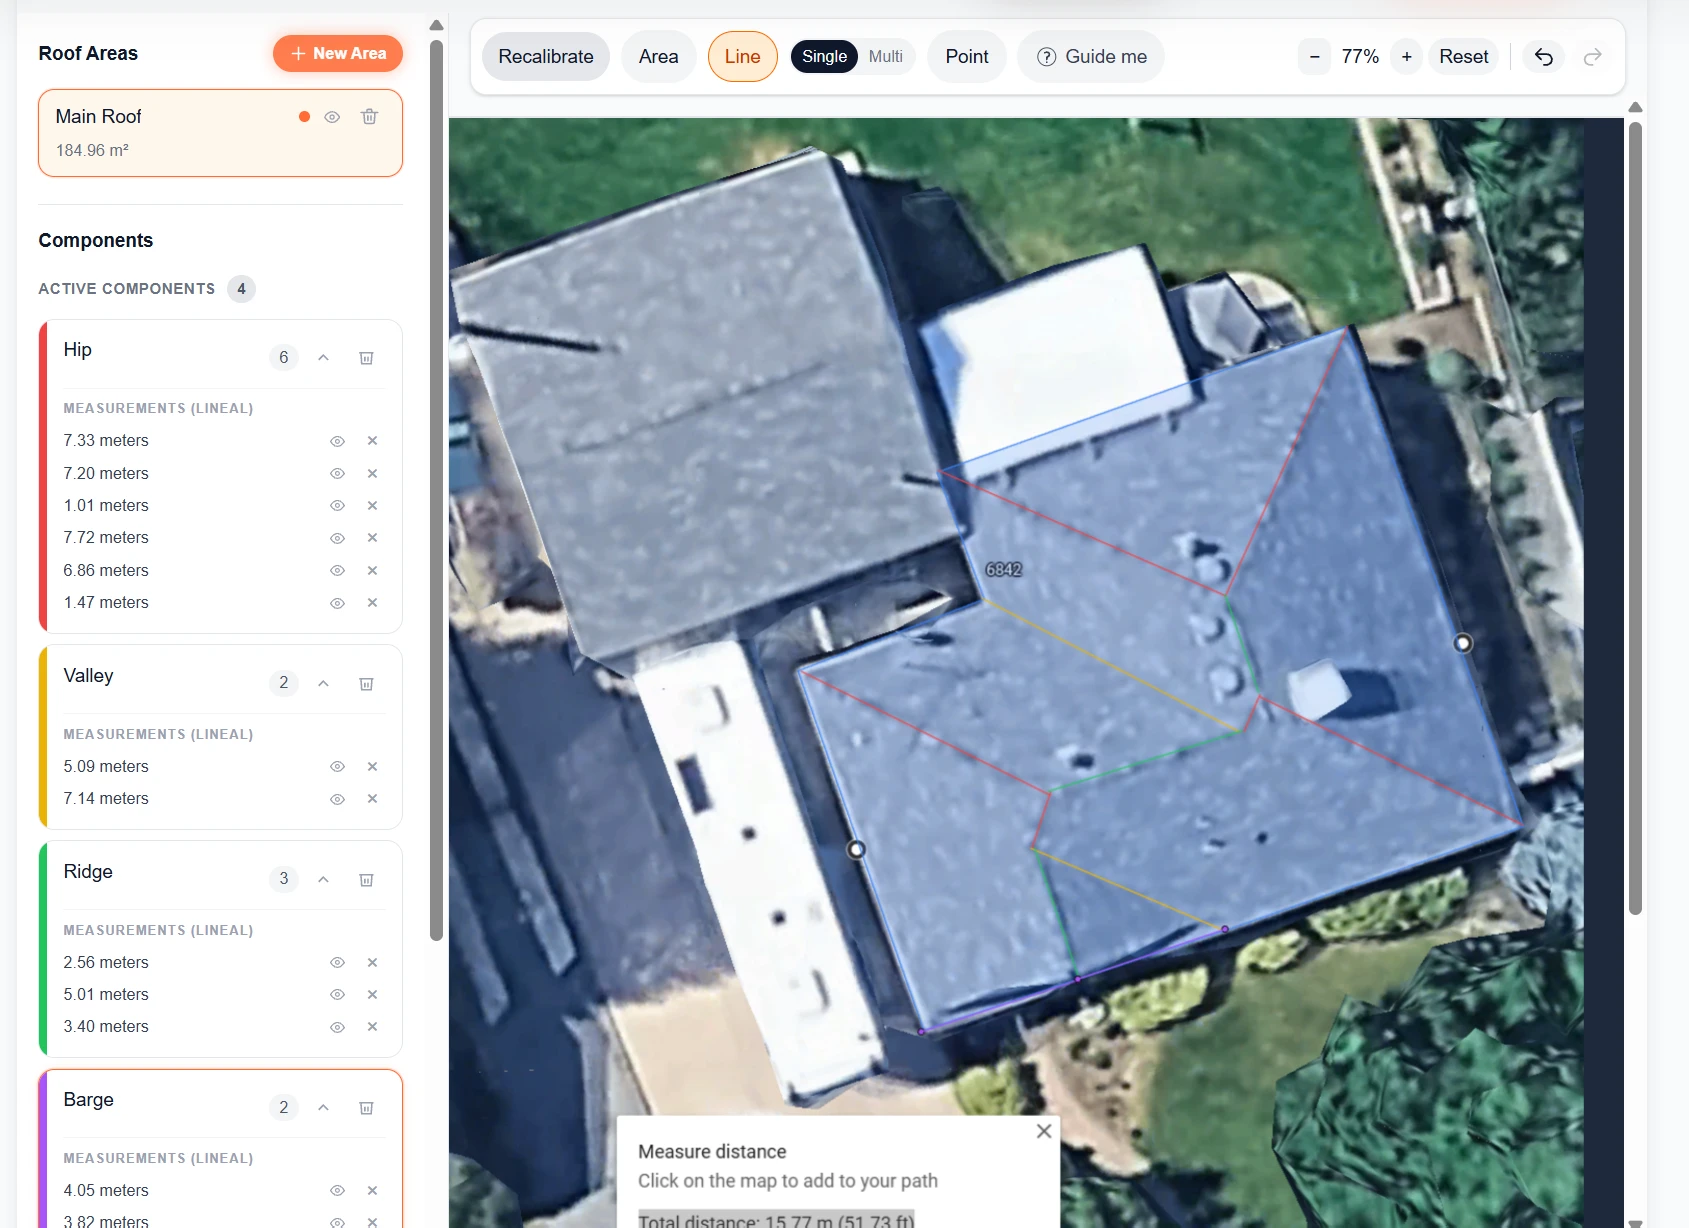
The aerial image was calibrated and every visible roof area/component was manually measured in QuoteCore+'s free takeoff tool.
04
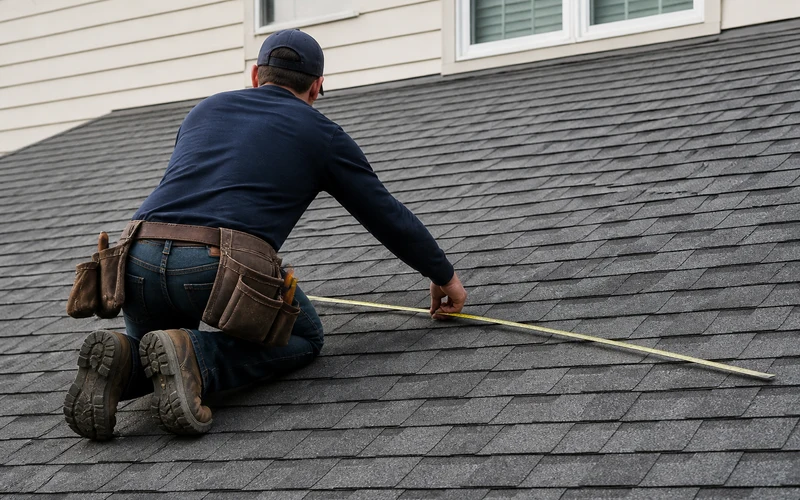
The same roof was physically measured on site and compared against the frozen digital result.
New to digital takeoffs? See how to measure a roof online from a plan or image.
The Simple / Medium / Complex labels describe the roof geometry, component count and overall installation complexity - not how difficult the roof should be to measure remotely. In this study, the more important factors were the quality of the source image, the accuracy of the scale calibration and whether the complete roof geometry was actually visible.
Several New Zealand roofs were steeper metal or concrete-tile roofs and required more care to access and move around on. Most US examples were asphalt-shingle roofs and were comparatively easier to walk. One New Zealand roof was measured accurately from the ground / sheet edge rather than by walking the full roof. Travel time was deliberately excluded from the timing comparison, so the reported 71.1% time reduction compares only the measuring process itself.
Yes - the measurement process is not country-specific. You need a sufficiently clear top-down satellite/aerial image, a scale or known dimension to calibrate it, and a usable side view or known pitch where slope adjustment is required.
This study physically verified five roofs in New Zealand and five in the United States, so the published 3.52% average area error applies to this 10-roof test set rather than every country or imagery provider. Image quality varies by address and region.
QuoteCore+'s free roof takeoff supports metric, imperial and roofing squares (metres and m², feet and ft², 1 square = 100 ft²), so the same workflow can be used by roofers and estimators working in the UK, Australia, New Zealand, Canada and the United States.
The limiting factor is usually the imagery, not the country.
If Google Earth imagery is not detailed enough at a particular address, the same QuoteCore takeoff can be performed using a clearer aerial, satellite, drone or plan image instead.
Roofing terminology changes by region. On this page, roof takeoff may also be called a roof take-off, roof measure, aerial roof measurement, satellite roof measurement, quantity takeoff or roof measurement report.
The published study dataset retains the exact QuoteCore+ component names used during the test.
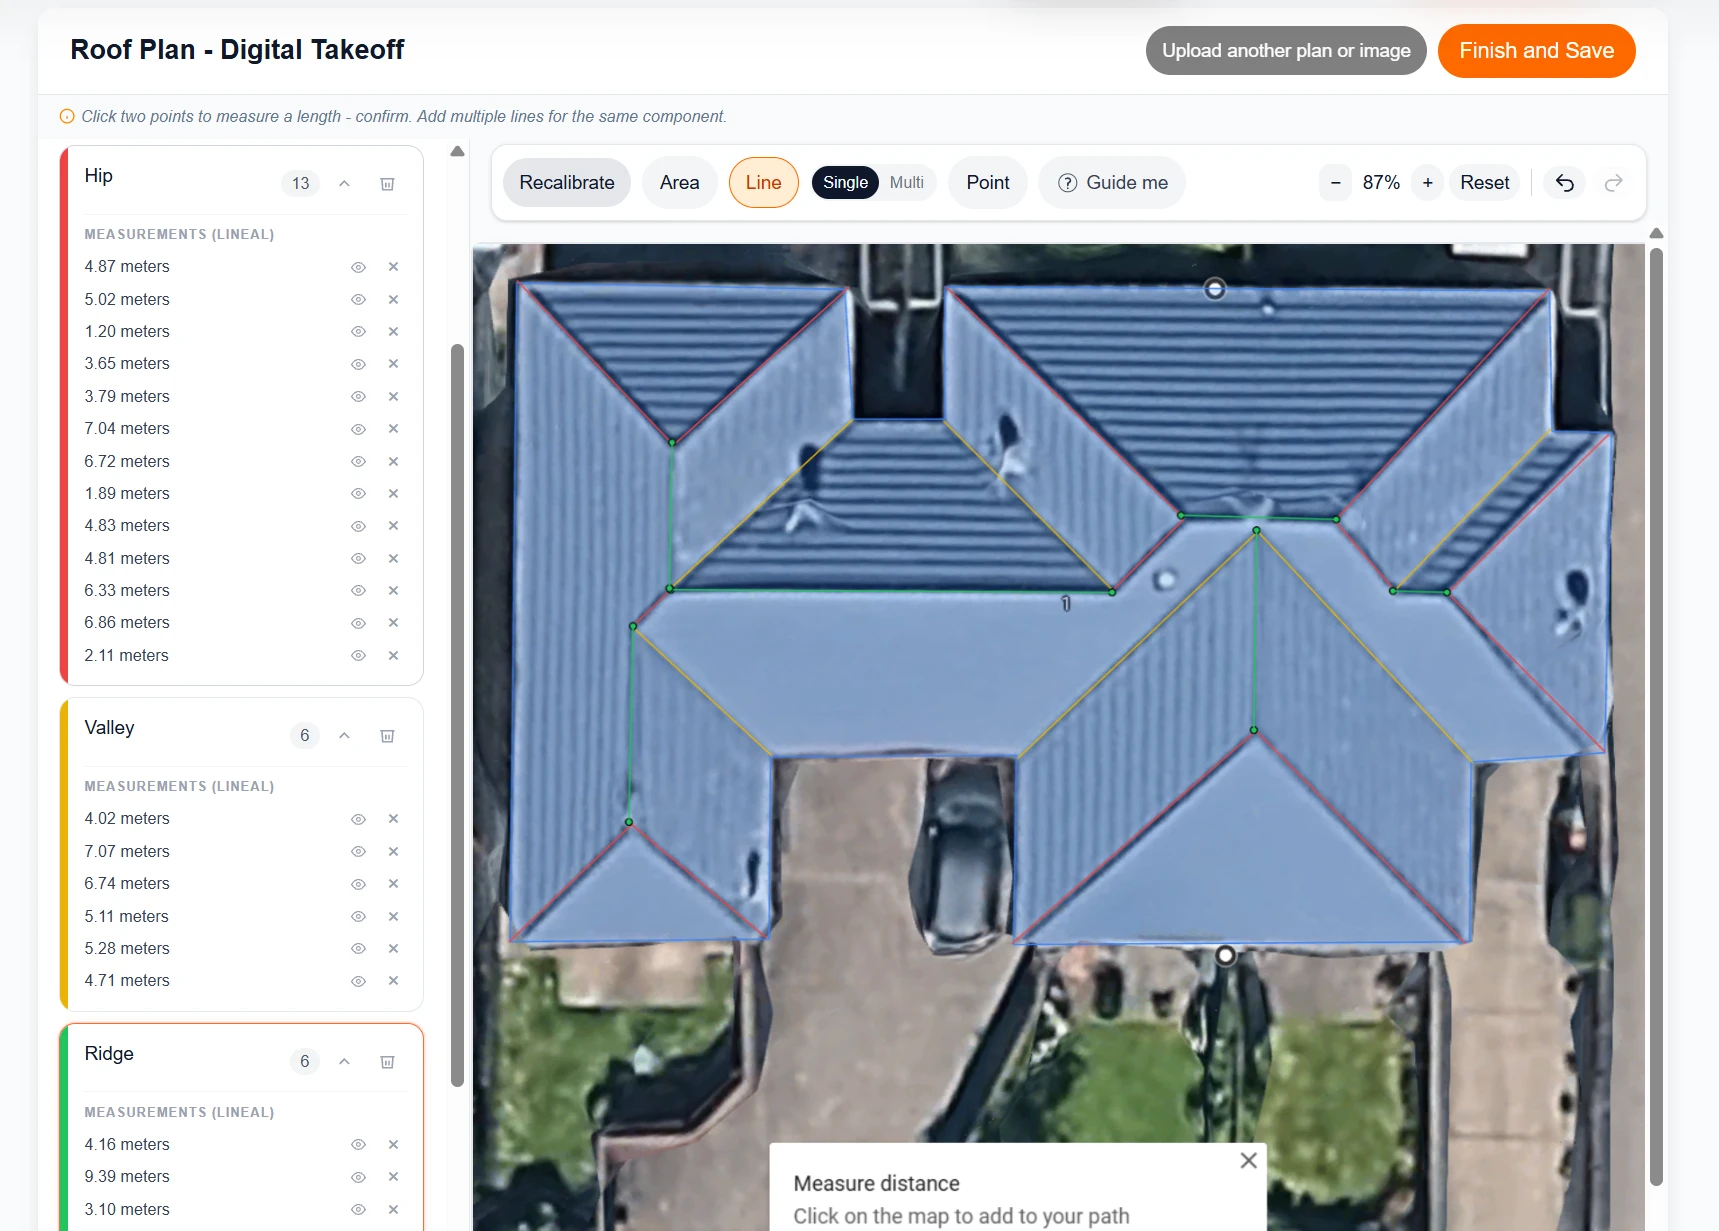
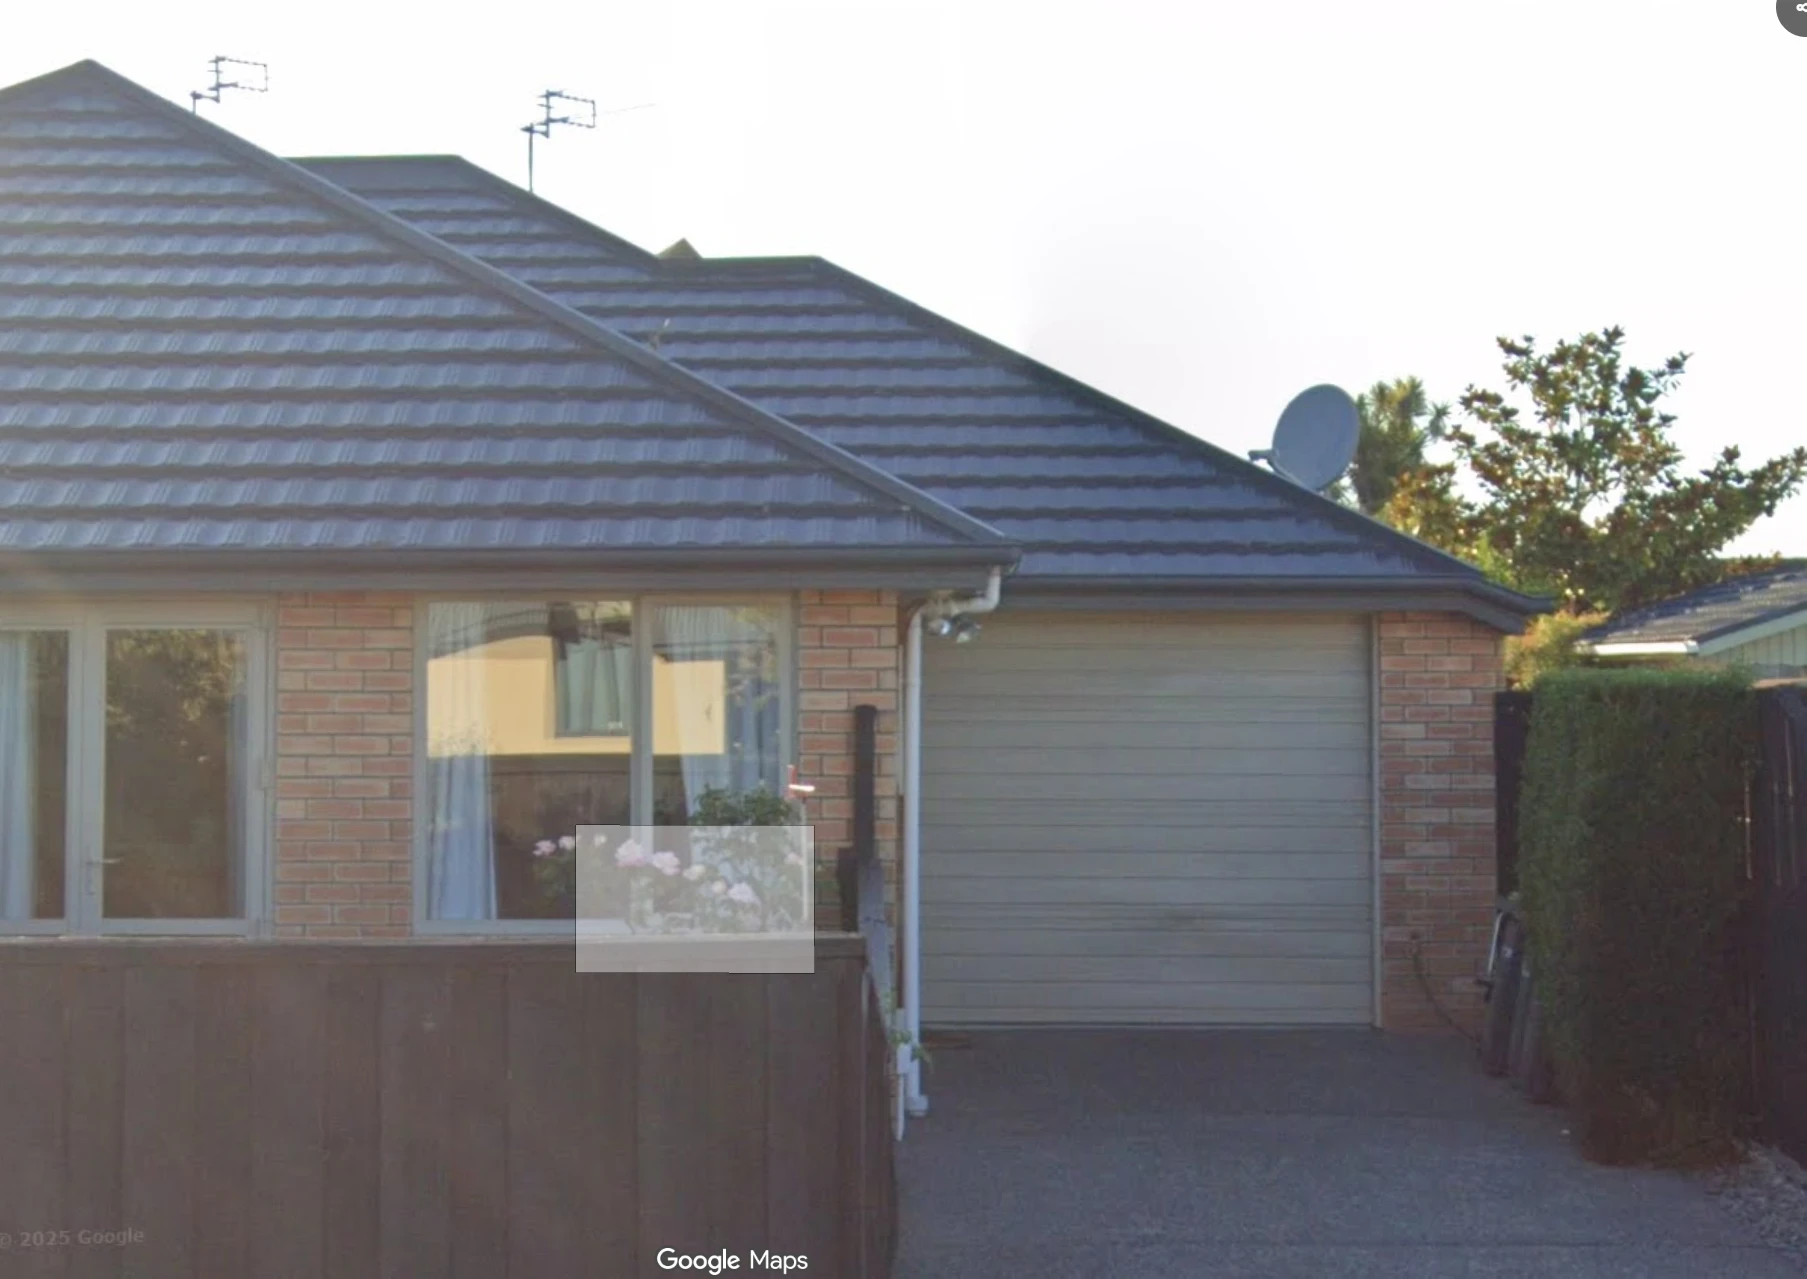
NZ-05 was one of the more geometrically complex roofs in the study, yet its digital area was within 3% of the physical measurement and every individual component was within 10%. Roof complexity alone did not determine remote accuracy in this sample - imagery quality, scale calibration and geometry visibility mattered more.
| Component | Entry | Digital | Physical | Difference | Abs. error |
|---|---|---|---|---|---|
| Roof Area | - | 311.33 m² | 302.3 m² | - | 2.99% |
| Ridge | 1 | 4.16 m | 4.20 m | -0.04 m | 1.0% |
| Ridge | 2 | 9.39 m | 9.50 m | -0.11 m | 1.2% |
| Ridge | 3 | 3.10 m | 3.20 m | -0.10 m | 3.1% |
| Ridge | 4 | 3.30 m | 3.20 m | 0.10 m | 3.1% |
| Ridge | 5 | 1.15 m | 1.20 m | -0.05 m | 4.2% |
| Ridge | 6 | 4.25 m | 4.20 m | 0.05 m | 1.2% |
| Hip | 1 | 5.13 m | 5.20 m | -0.07 m | 1.3% |
| Hip | 2 | 5.29 m | 5.20 m | 0.09 m | 1.7% |
| Hip | 3 | 1.26 m | 1.40 m | -0.14 m | 10.0% |
| Hip | 4 | 3.85 m | 3.90 m | -0.05 m | 1.3% |
| Hip | 5 | 3.99 m | 3.90 m | 0.09 m | 2.3% |
| Hip | 6 | 7.42 m | 7.20 m | 0.22 m | 3.1% |
| Hip | 7 | 7.08 m | 7.20 m | -0.12 m | 1.7% |
| Hip | 8 | 1.99 m | 2.10 m | -0.11 m | 5.2% |
| Hip | 9 | 5.09 m | 5 m | 0.09 m | 1.8% |
| Hip | 10 | 5.06 m | 5 m | 0.06 m | 1.2% |
| Hip | 11 | 6.67 m | 6.90 m | -0.23 m | 3.3% |
| Hip | 12 | 7.22 m | 6.90 m | 0.32 m | 4.6% |
| Hip | 13 | 2.22 m | 2.10 m | 0.12 m | 5.7% |
| Valley | 1 | 4.23 m | 4.10 m | 0.13 m | 3.2% |
| Valley | 2 | 7.44 m | 7.30 m | 0.14 m | 1.9% |
| Valley | 3 | 7.10 m | 7.30 m | -0.20 m | 2.7% |
| Valley | 4 | 5.39 m | 5.50 m | -0.11 m | 2.0% |
| Valley | 5 | 5.56 m | 5.50 m | 0.06 m | 1.1% |
| Valley | 6 | 4.96 m | 5 m | -0.04 m | 0.8% |
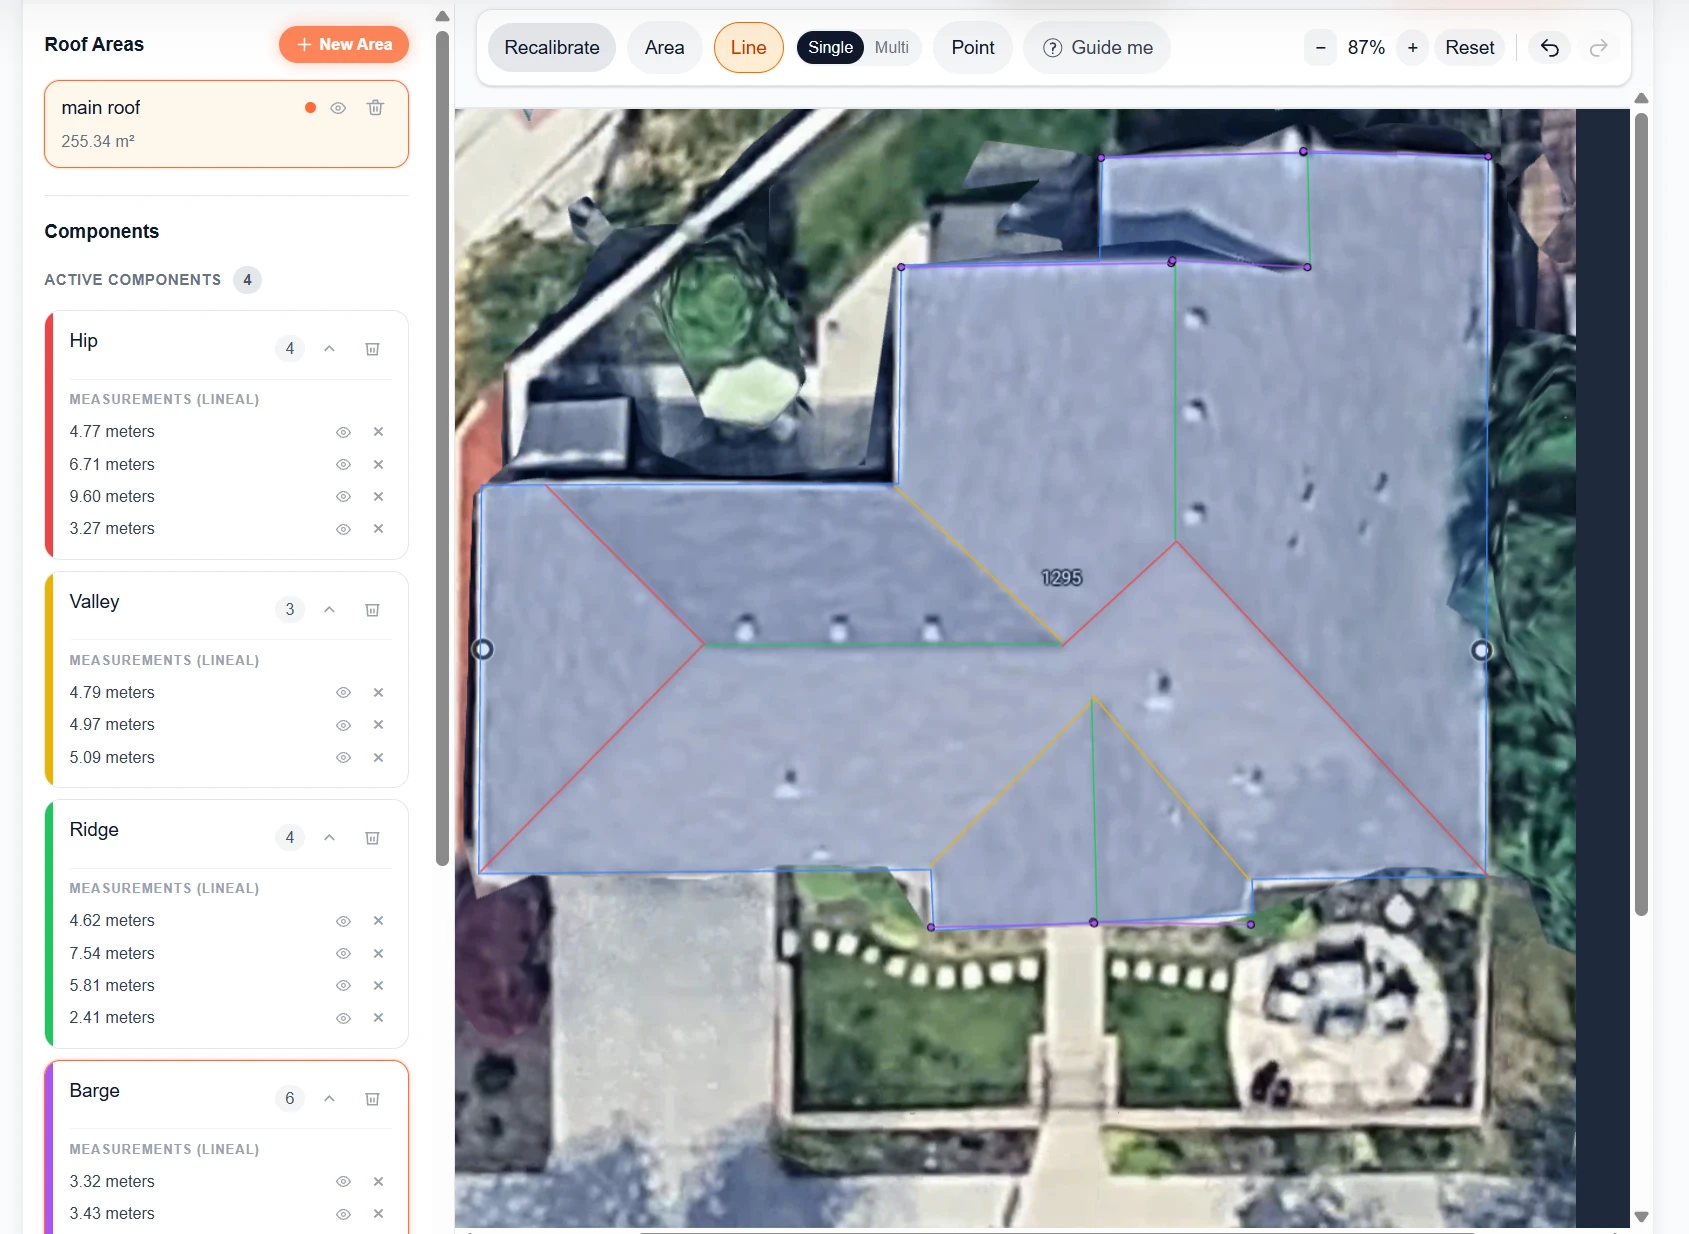
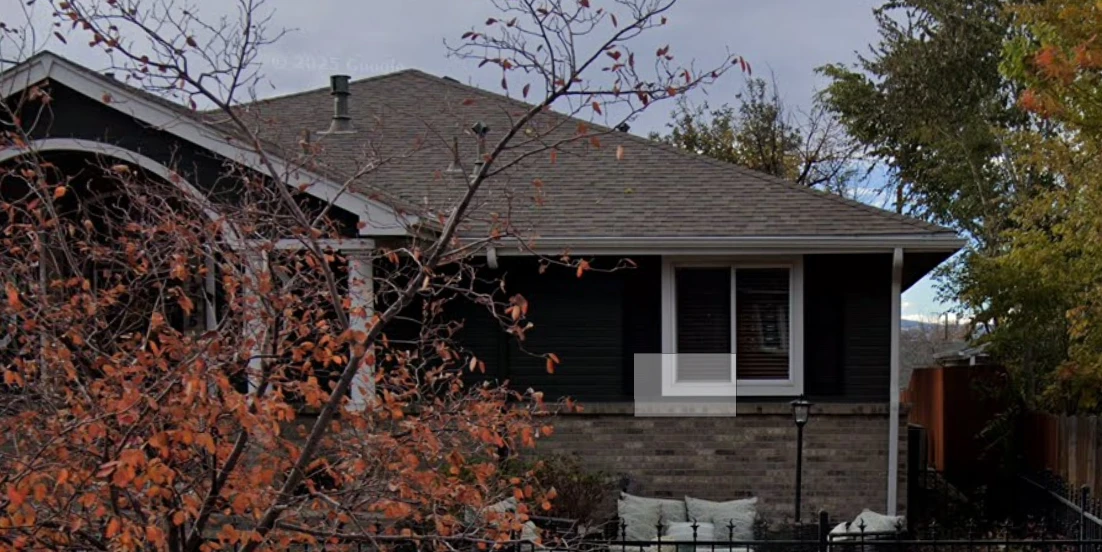
US-03 returned one of the strongest detailed takeoffs in the test: the total roof area was within 2%, 16 of 17 individual component measurements were within 5%, and the complete remote measurement was finished in under three minutes.
| Component | Entry | Digital | Physical | Difference | Abs. error |
|---|---|---|---|---|---|
| Roof Area | - | 267.73 m² | 272.9 m² | - | 1.89% |
| Ridge | 1 | 4.62 m | 4.70 m | -0.08 m | 1.7% |
| Ridge | 2 | 7.54 m | 7.60 m | -0.06 m | 0.8% |
| Ridge | 3 | 5.81 m | 5.80 m | 0.01 m | 0.2% |
| Ridge | 4 | 2.41 m | 2.50 m | -0.09 m | 3.6% |
| Hip | 1 | 4.89 m | 5 m | -0.11 m | 2.2% |
| Hip | 2 | 6.88 m | 6.90 m | -0.02 m | 0.3% |
| Hip | 3 | 9.84 m | 10 m | -0.16 m | 1.6% |
| Hip | 4 | 3.35 m | 3.40 m | -0.05 m | 1.5% |
| Valley | 1 | 4.91 m | 5 m | -0.09 m | 1.8% |
| Valley | 2 | 5.09 m | 5 m | 0.09 m | 1.8% |
| Valley | 3 | 5.21 m | 5 m | 0.21 m | 4.2% |
| Barge | 1 | 3.48 m | 3.50 m | -0.02 m | 0.6% |
| Barge | 2 | 3.60 m | 3.50 m | 0.10 m | 2.9% |
| Barge | 3 | 5.94 m | 6 m | -0.06 m | 1.0% |
| Barge | 4 | 2.98 m | 3 m | -0.02 m | 0.7% |
| Barge | 5 | 4.46 m | 4.30 m | 0.16 m | 3.7% |
| Barge | 6 | 4.07 m | 4.30 m | -0.23 m | 5.3% |
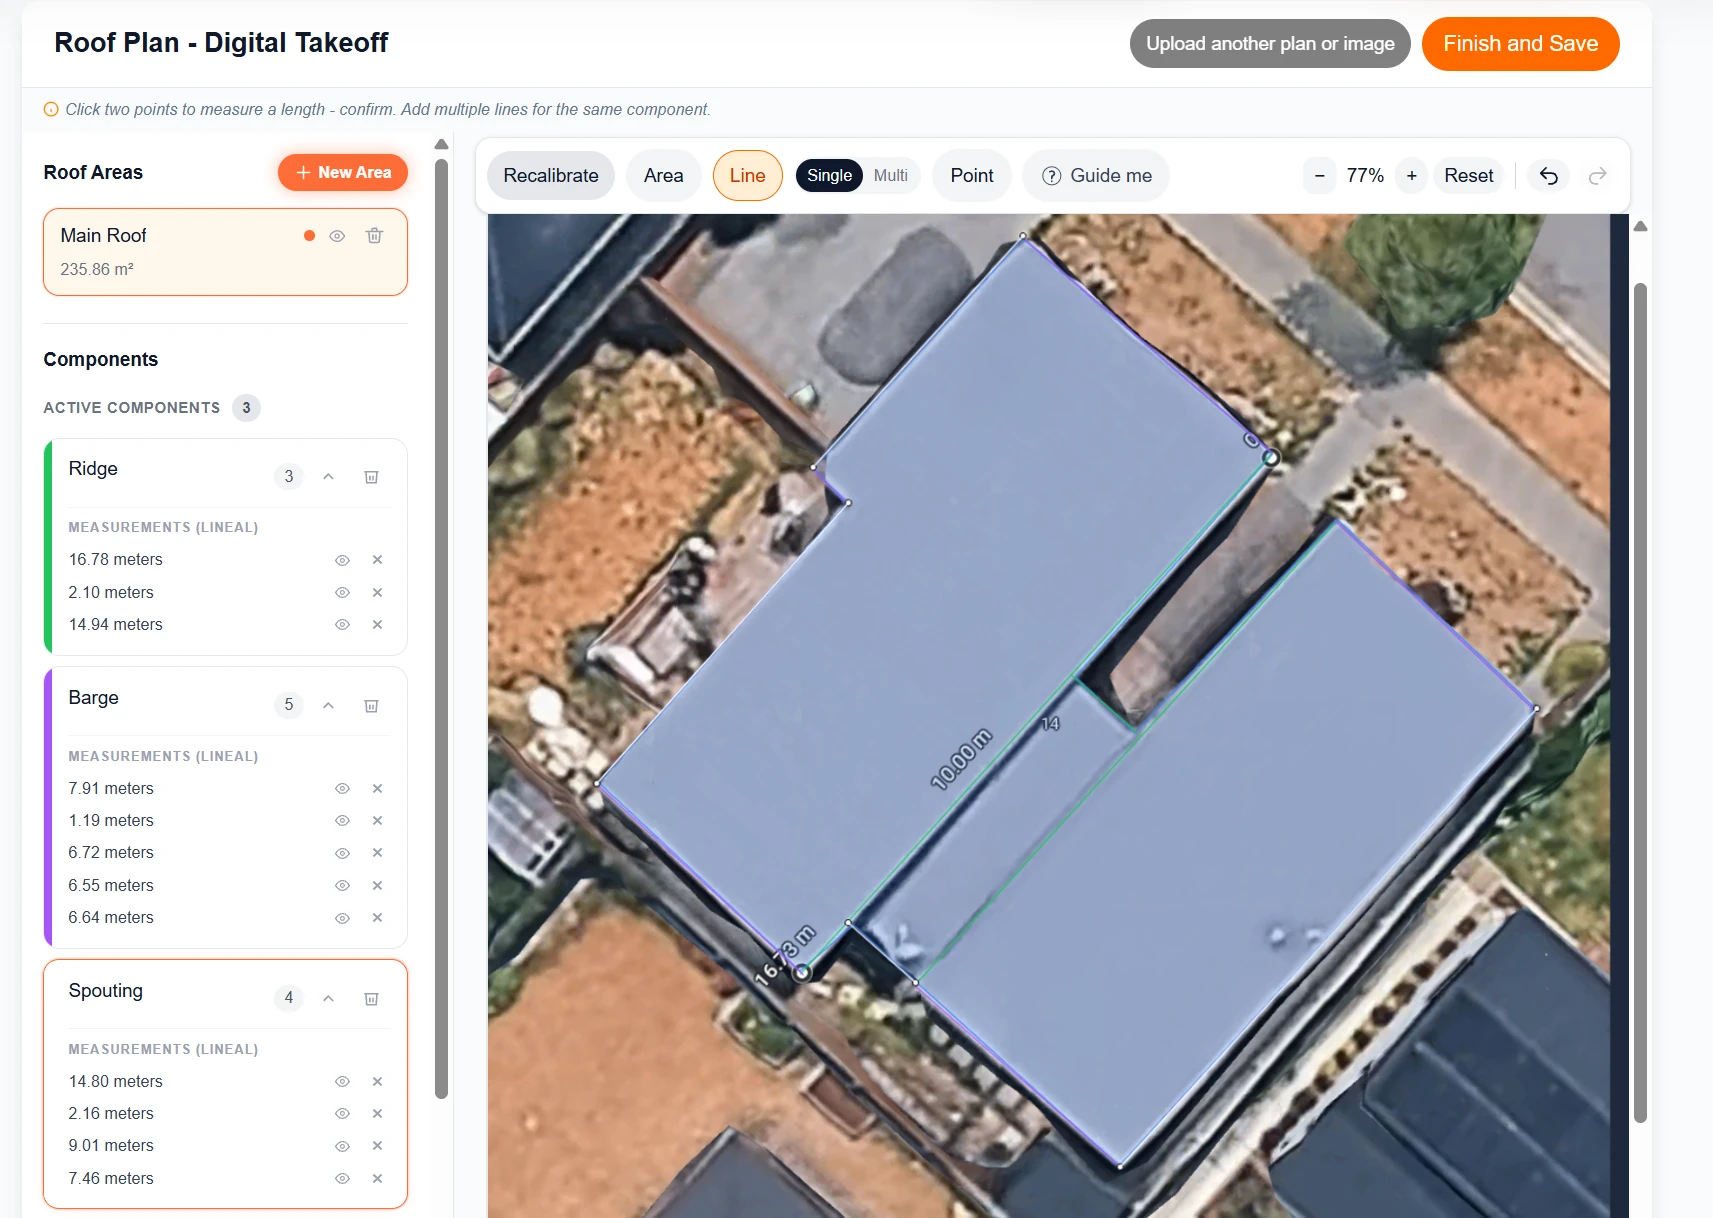
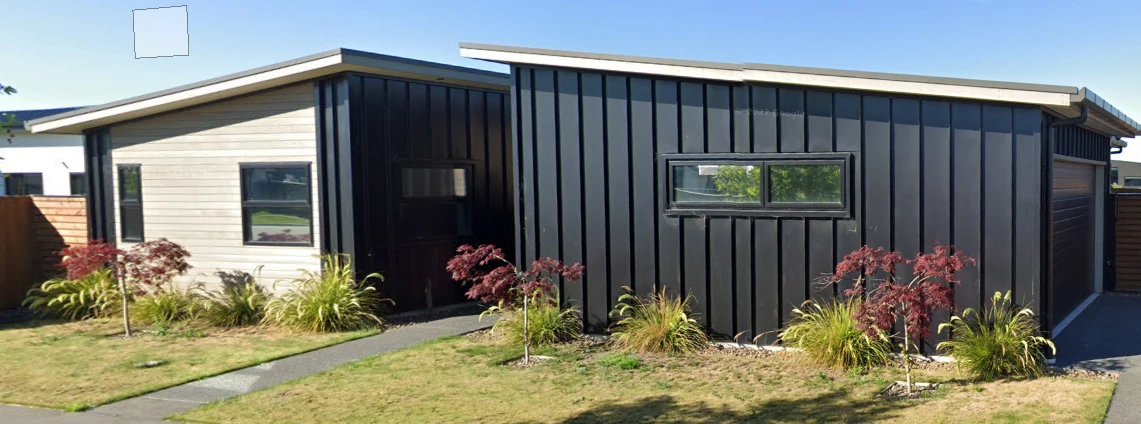
NZ-01 produced two of the largest individual errors in the study. Part of a lower roof continued beneath an upper roof/soffit and could not be identified from the available aerial or Street View imagery.
One edge recorded with the default Ridge component measured 2.10 m remotely vs 3.00 m on site, while the corresponding spouting run measured 2.16 m remotely vs 3.00 m on site.
This is an important limitation of remote takeoff: the software can only measure geometry that can actually be identified from the available imagery.
Remote imagery can only measure geometry you can identify.
Upper roofs, soffits, parapets, trees, overlapping structures and poor viewing angles can hide real dimensions. If the complete roof cannot be confidently seen, treat the result as an estimating aid and verify before ordering or relying on critical dimensions.
This is a 10-roof internal field study, not a universal accuracy guarantee for Google Earth or all satellite measurement systems. The roofs were residential properties in New Zealand and the United States that could be physically checked. Image date, resolution, scale calibration, perspective, tree cover and hidden roof geometry vary by property and location. Physical measurements were used as the comparison point but were collected under normal real-world roofing conditions rather than controlled survey-laboratory conditions.
Summary and full component-level measurements for each roof. NZ-05 and US-03 are featured in detail above.
| Component | Entry | Digital | Physical | Difference | Abs. error |
|---|---|---|---|---|---|
| Roof Area | - | 237.63 m² | 232.5 m² | - | 2.21% |
| Ridge | 1 | 16.78 m | 16.60 m | 0.18 m | 1.1% |
| Barge | Hidden section | 2.10 m | 3 m | -0.90 m | 30.0% |
| Ridge | 3 | 14.94 m | 14.90 m | 0.04 m | 0.3% |
| Barge | 1 | 7.97 m | 7.80 m | 0.17 m | 2.2% |
| Barge | 2 | 1.20 m | 1.10 m | 0.10 m | 9.1% |
| Barge | 3 | 6.77 m | 6.70 m | 0.07 m | 1.0% |
| Barge | 4 | 6.59 m | 6.40 m | 0.19 m | 3.0% |
| Barge | 5 | 6.69 m | 6.40 m | 0.29 m | 4.5% |
| Spouting | 1 | 14.80 m | 14.90 m | -0.10 m | 0.7% |
| Spouting | 2 | 2.16 m | 3 m | -0.84 m | 28.0% |
| Spouting | 3 | 9.01 m | 8.90 m | 0.11 m | 1.2% |
| Spouting | 4 | 7.46 m | 7.20 m | 0.26 m | 3.6% |
Featured visibility-limit example: part of a lower roof was hidden beneath upper roof/soffit geometry and could not be identified from the available top-down and Street View views. Two short edge measurements were therefore substantially under-measured.
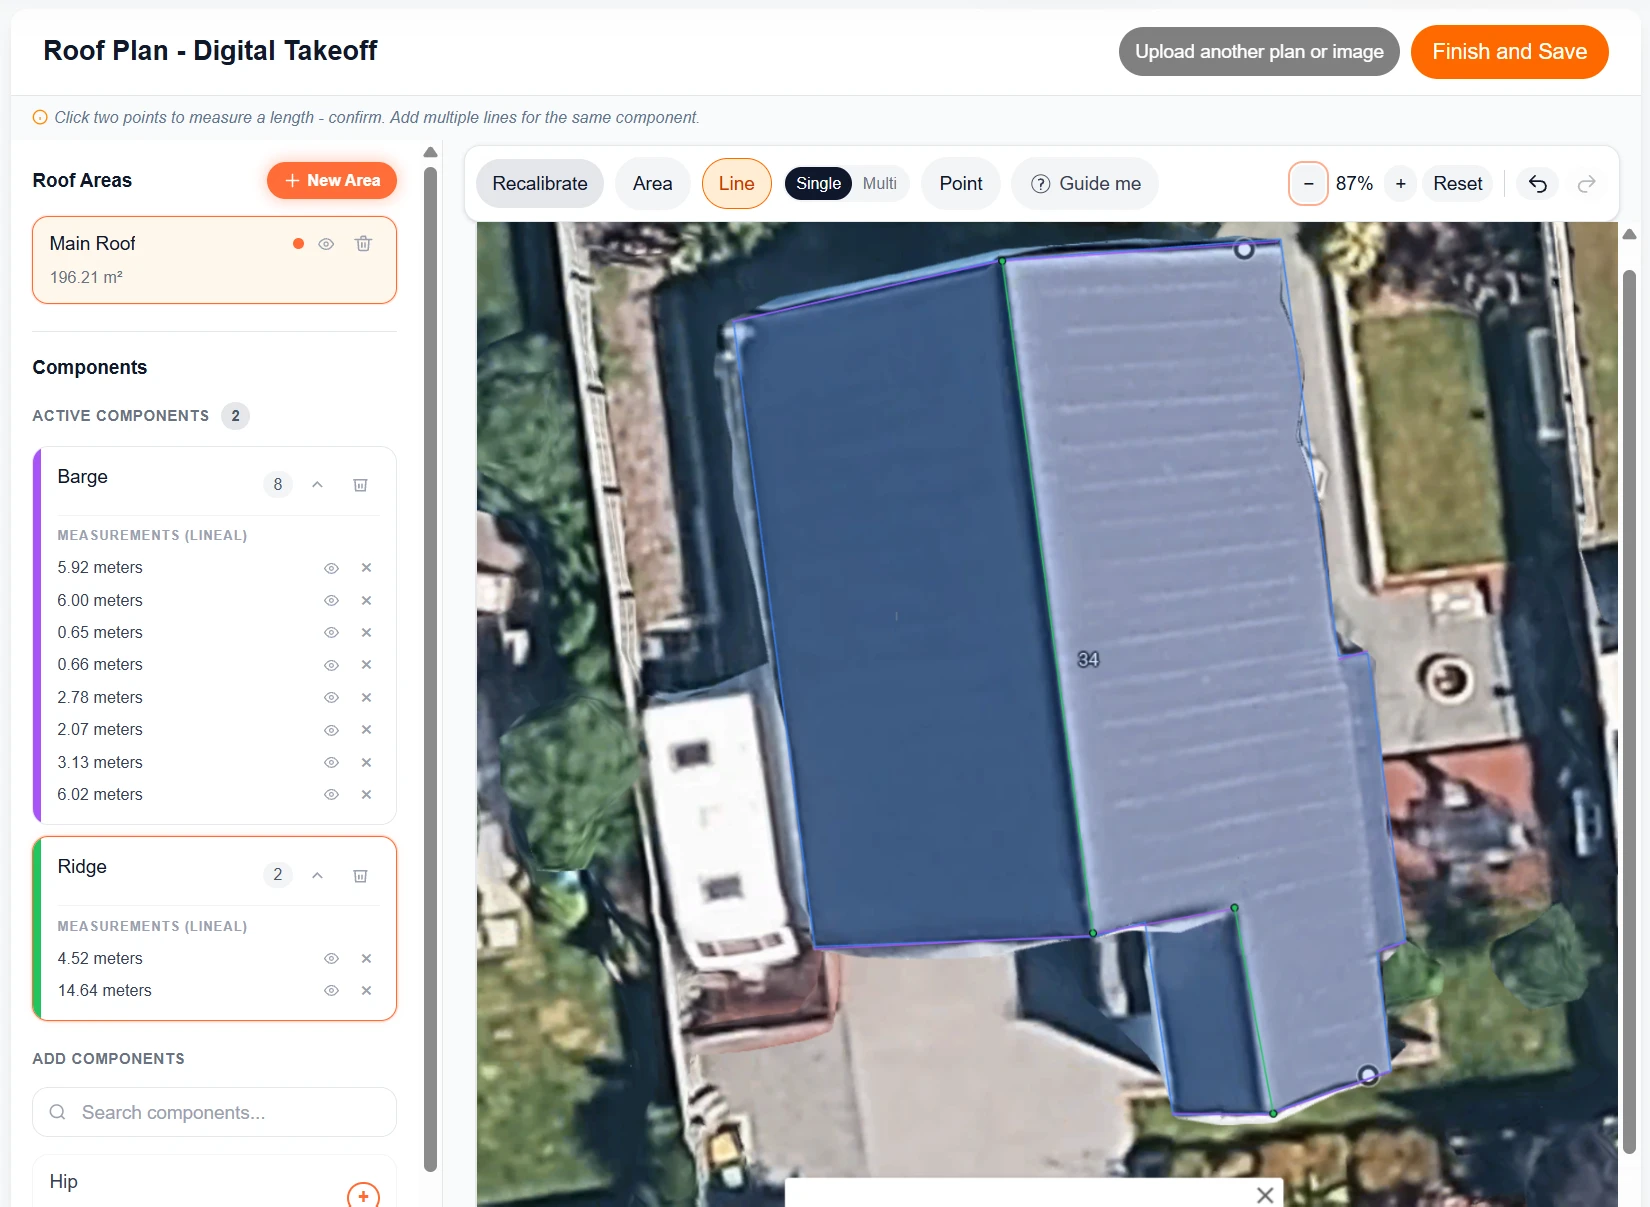
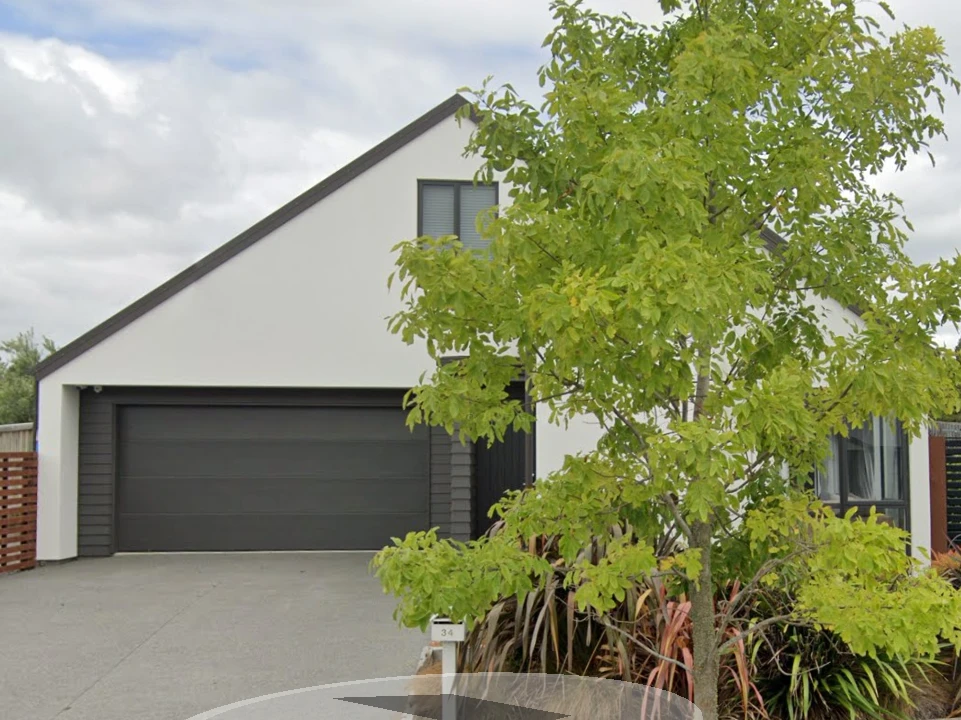
| Component | Entry | Digital | Physical | Difference | Abs. error |
|---|---|---|---|---|---|
| Roof Area | - | 233.95 m² | 215 m² | - | 8.81% |
| Ridge | 1 | 4.52 m | 4.40 m | 0.12 m | 2.7% |
| Ridge | 2 | 14.64 m | 14.20 m | 0.44 m | 3.1% |
| Barge | 1 | 7.06 m | 7 m | 0.06 m | 0.9% |
| Barge | 2 | 7.16 m | 7 m | 0.16 m | 2.3% |
| Barge | 3 | 0.78 m | 0.70 m | 0.08 m | 11.4% |
| Barge | 4 | 0.79 m | 0.70 m | 0.09 m | 12.9% |
| Barge | 5 | 3.31 m | 3.30 m | 0.01 m | 0.3% |
| Barge | 6 | 2.46 m | 2.40 m | 0.06 m | 2.5% |
| Barge | 7 | 3.74 m | 3.70 m | 0.04 m | 1.1% |
| Barge | 8 | 7.18 m | 7.10 m | 0.08 m | 1.1% |
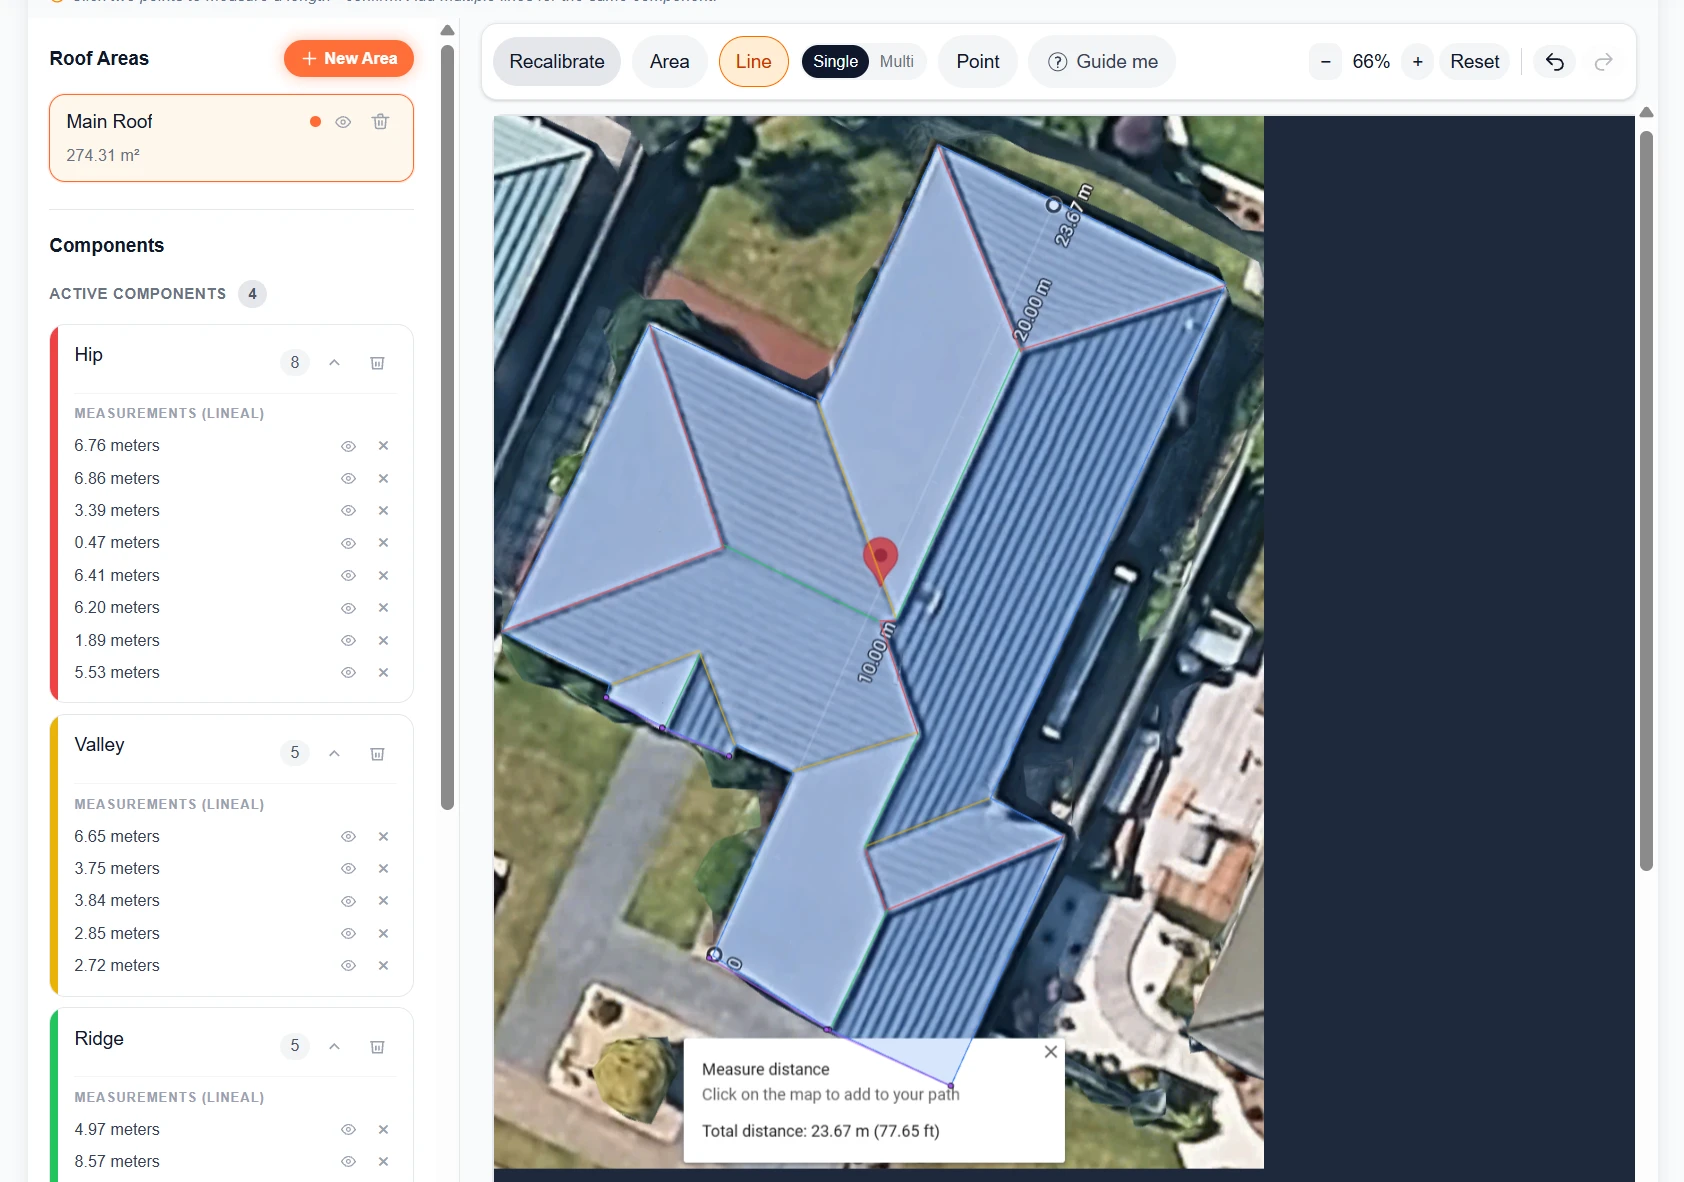
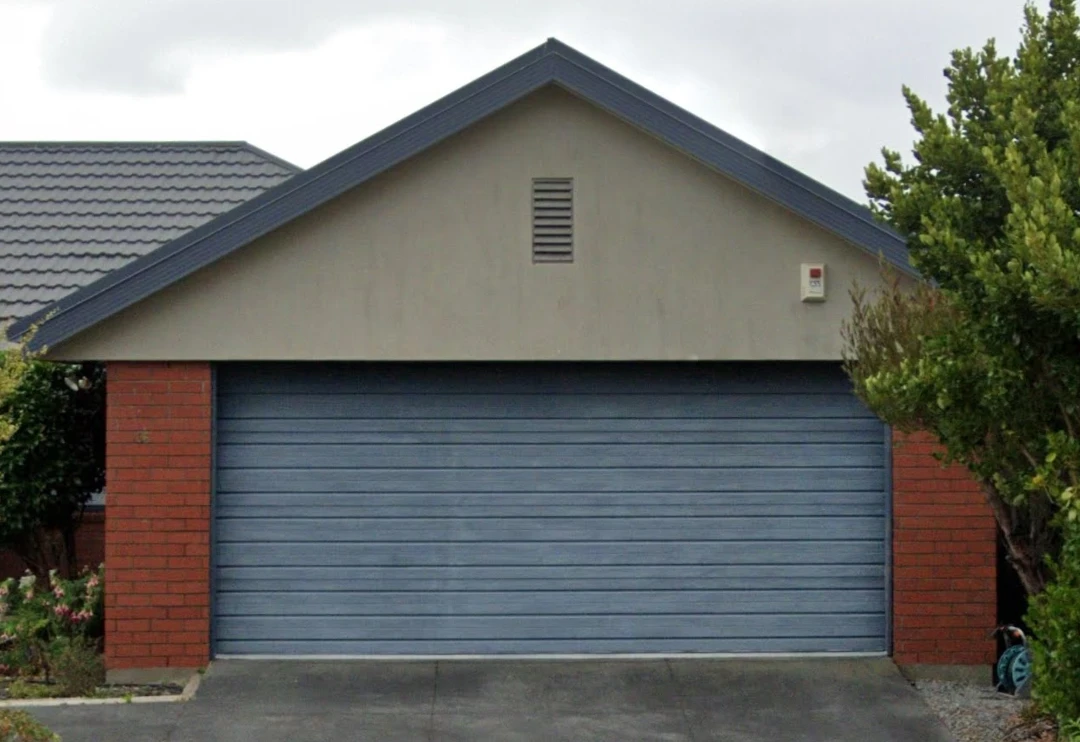
| Component | Entry | Digital | Physical | Difference | Abs. error |
|---|---|---|---|---|---|
| Roof Area | - | 309.12 m² | 301 m² | - | 2.70% |
| Ridge | 1 | 4.97 m | 5.10 m | -0.13 m | 2.5% |
| Ridge | 2 | 8.57 m | 8.70 m | -0.13 m | 1.5% |
| Ridge | 3 | 3.70 m | 3.60 m | 0.10 m | 2.8% |
| Ridge | 4 | 2.36 m | 2.40 m | -0.04 m | 1.7% |
| Ridge | 5 | 3.83 m | 3.90 m | -0.07 m | 1.8% |
| Hip | 1 | 7.20 m | 7.30 m | -0.10 m | 1.4% |
| Hip | 2 | 7.31 m | 7.30 m | 0.01 m | 0.1% |
| Hip | 3 | 3.61 m | 3.50 m | 0.11 m | 3.1% |
| Hip | 4 | 0.50 m | 0.60 m | -0.10 m | 16.7% |
| Hip | 5 | 6.83 m | 6.70 m | 0.13 m | 1.9% |
| Hip | 6 | 6.60 m | 6.70 m | -0.10 m | 1.5% |
| Hip | 7 | 2.01 m | 2 m | 0.01 m | 0.5% |
| Hip | 8 | 5.89 m | 6 m | -0.11 m | 1.8% |
| Valley | 1 | 7.08 m | 7.10 m | -0.02 m | 0.3% |
| Valley | 2 | 3.99 m | 4 m | -0.01 m | 0.3% |
| Valley | 3 | 4.09 m | 4 m | 0.09 m | 2.3% |
| Valley | 4 | 3.04 m | 3 m | 0.04 m | 1.3% |
| Valley | 5 | 2.89 m | 3 m | -0.11 m | 3.7% |
| Barge | 1 | 2.08 m | 2.15 m | -0.07 m | 3.3% |
| Barge | 2 | 2.35 m | 2.15 m | 0.20 m | 9.3% |
| Barge | 3 | 4.52 m | 4.50 m | 0.02 m | 0.4% |
| Barge | 4 | 4.43 m | 4.50 m | -0.07 m | 1.6% |
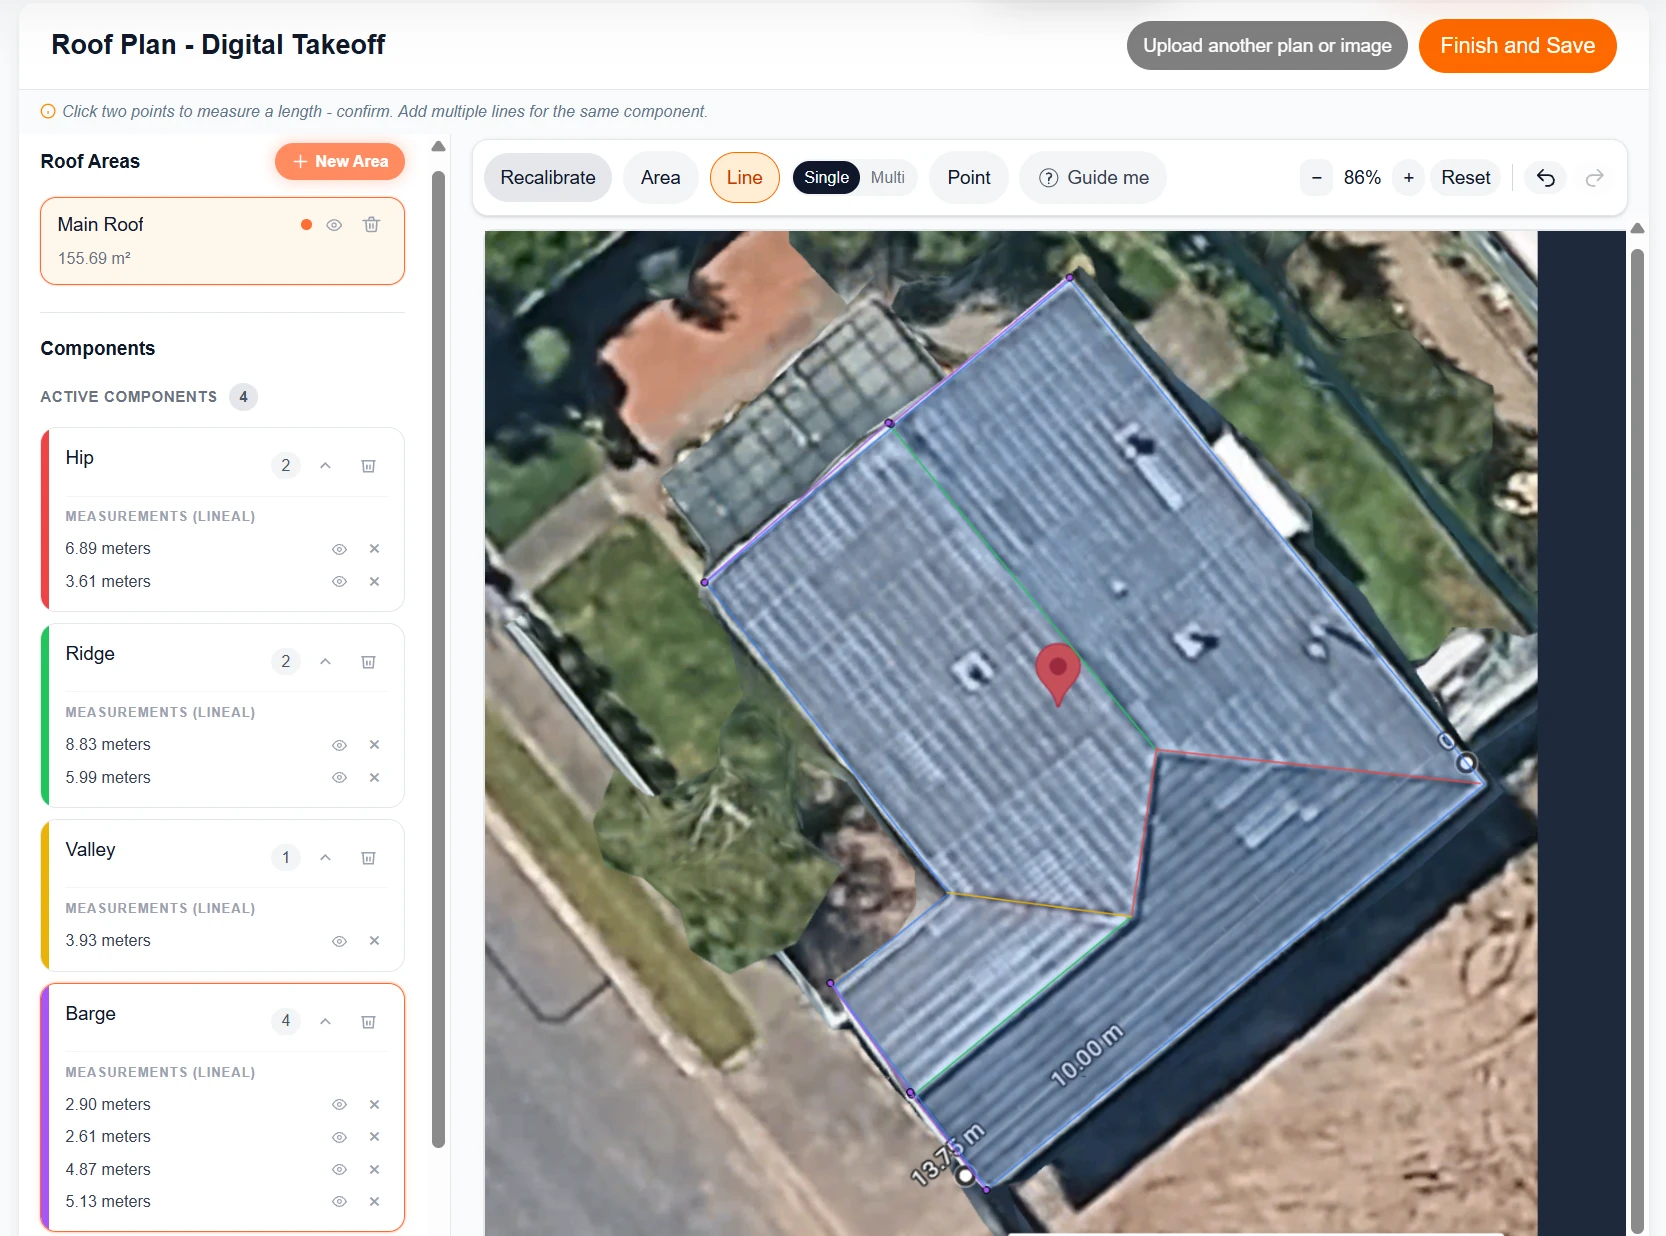
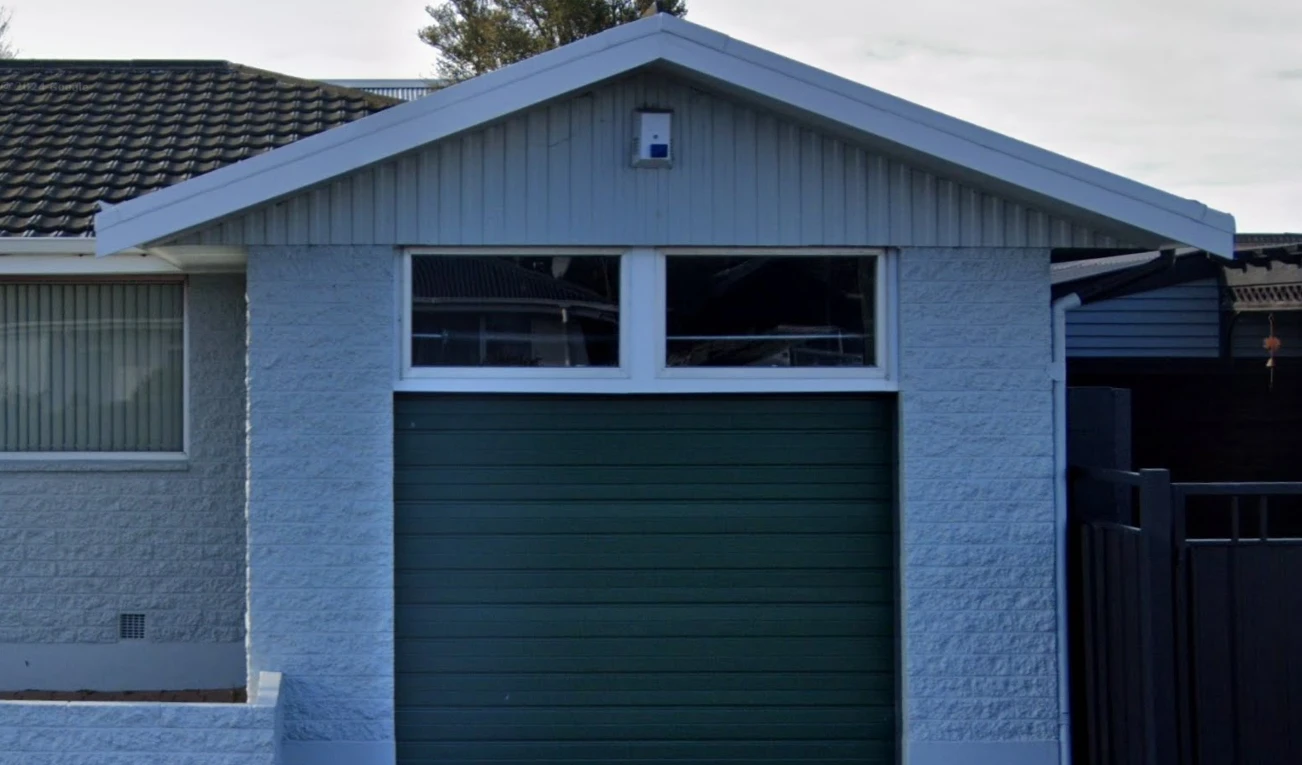
| Component | Entry | Digital | Physical | Difference | Abs. error |
|---|---|---|---|---|---|
| Roof Area | - | 165.69 m² | 171 m² | - | 3.10% |
| Ridge | 1 | 8.83 m | 8.90 m | -0.07 m | 0.8% |
| Ridge | 2 | 5.99 m | 6 m | -0.01 m | 0.2% |
| Hip | 1 | 7.11 m | 7 m | 0.11 m | 1.6% |
| Hip | 2 | 3.72 m | 3.80 m | -0.08 m | 2.1% |
| Valley | 1 | 4.06 m | 4 m | 0.06 m | 1.5% |
| Barge | 1 | 3.09 m | 3 m | 0.09 m | 3.0% |
| Barge | 2 | 2.78 m | 3 m | -0.22 m | 7.3% |
| Barge | 3 | 5.18 m | 5.30 m | -0.12 m | 2.3% |
| Barge | 4 | 5.46 m | 5.30 m | 0.16 m | 3.0% |
| Component | Entry | Digital | Physical | Difference | Abs. error |
|---|---|---|---|---|---|
| Roof Area | - | 311.33 m² | 302.3 m² | - | 2.99% |
| Ridge | 1 | 4.16 m | 4.20 m | -0.04 m | 1.0% |
| Ridge | 2 | 9.39 m | 9.50 m | -0.11 m | 1.2% |
| Ridge | 3 | 3.10 m | 3.20 m | -0.10 m | 3.1% |
| Ridge | 4 | 3.30 m | 3.20 m | 0.10 m | 3.1% |
| Ridge | 5 | 1.15 m | 1.20 m | -0.05 m | 4.2% |
| Ridge | 6 | 4.25 m | 4.20 m | 0.05 m | 1.2% |
| Hip | 1 | 5.13 m | 5.20 m | -0.07 m | 1.3% |
| Hip | 2 | 5.29 m | 5.20 m | 0.09 m | 1.7% |
| Hip | 3 | 1.26 m | 1.40 m | -0.14 m | 10.0% |
| Hip | 4 | 3.85 m | 3.90 m | -0.05 m | 1.3% |
| Hip | 5 | 3.99 m | 3.90 m | 0.09 m | 2.3% |
| Hip | 6 | 7.42 m | 7.20 m | 0.22 m | 3.1% |
| Hip | 7 | 7.08 m | 7.20 m | -0.12 m | 1.7% |
| Hip | 8 | 1.99 m | 2.10 m | -0.11 m | 5.2% |
| Hip | 9 | 5.09 m | 5 m | 0.09 m | 1.8% |
| Hip | 10 | 5.06 m | 5 m | 0.06 m | 1.2% |
| Hip | 11 | 6.67 m | 6.90 m | -0.23 m | 3.3% |
| Hip | 12 | 7.22 m | 6.90 m | 0.32 m | 4.6% |
| Hip | 13 | 2.22 m | 2.10 m | 0.12 m | 5.7% |
| Valley | 1 | 4.23 m | 4.10 m | 0.13 m | 3.2% |
| Valley | 2 | 7.44 m | 7.30 m | 0.14 m | 1.9% |
| Valley | 3 | 7.10 m | 7.30 m | -0.20 m | 2.7% |
| Valley | 4 | 5.39 m | 5.50 m | -0.11 m | 2.0% |
| Valley | 5 | 5.56 m | 5.50 m | 0.06 m | 1.1% |
| Valley | 6 | 4.96 m | 5 m | -0.04 m | 0.8% |
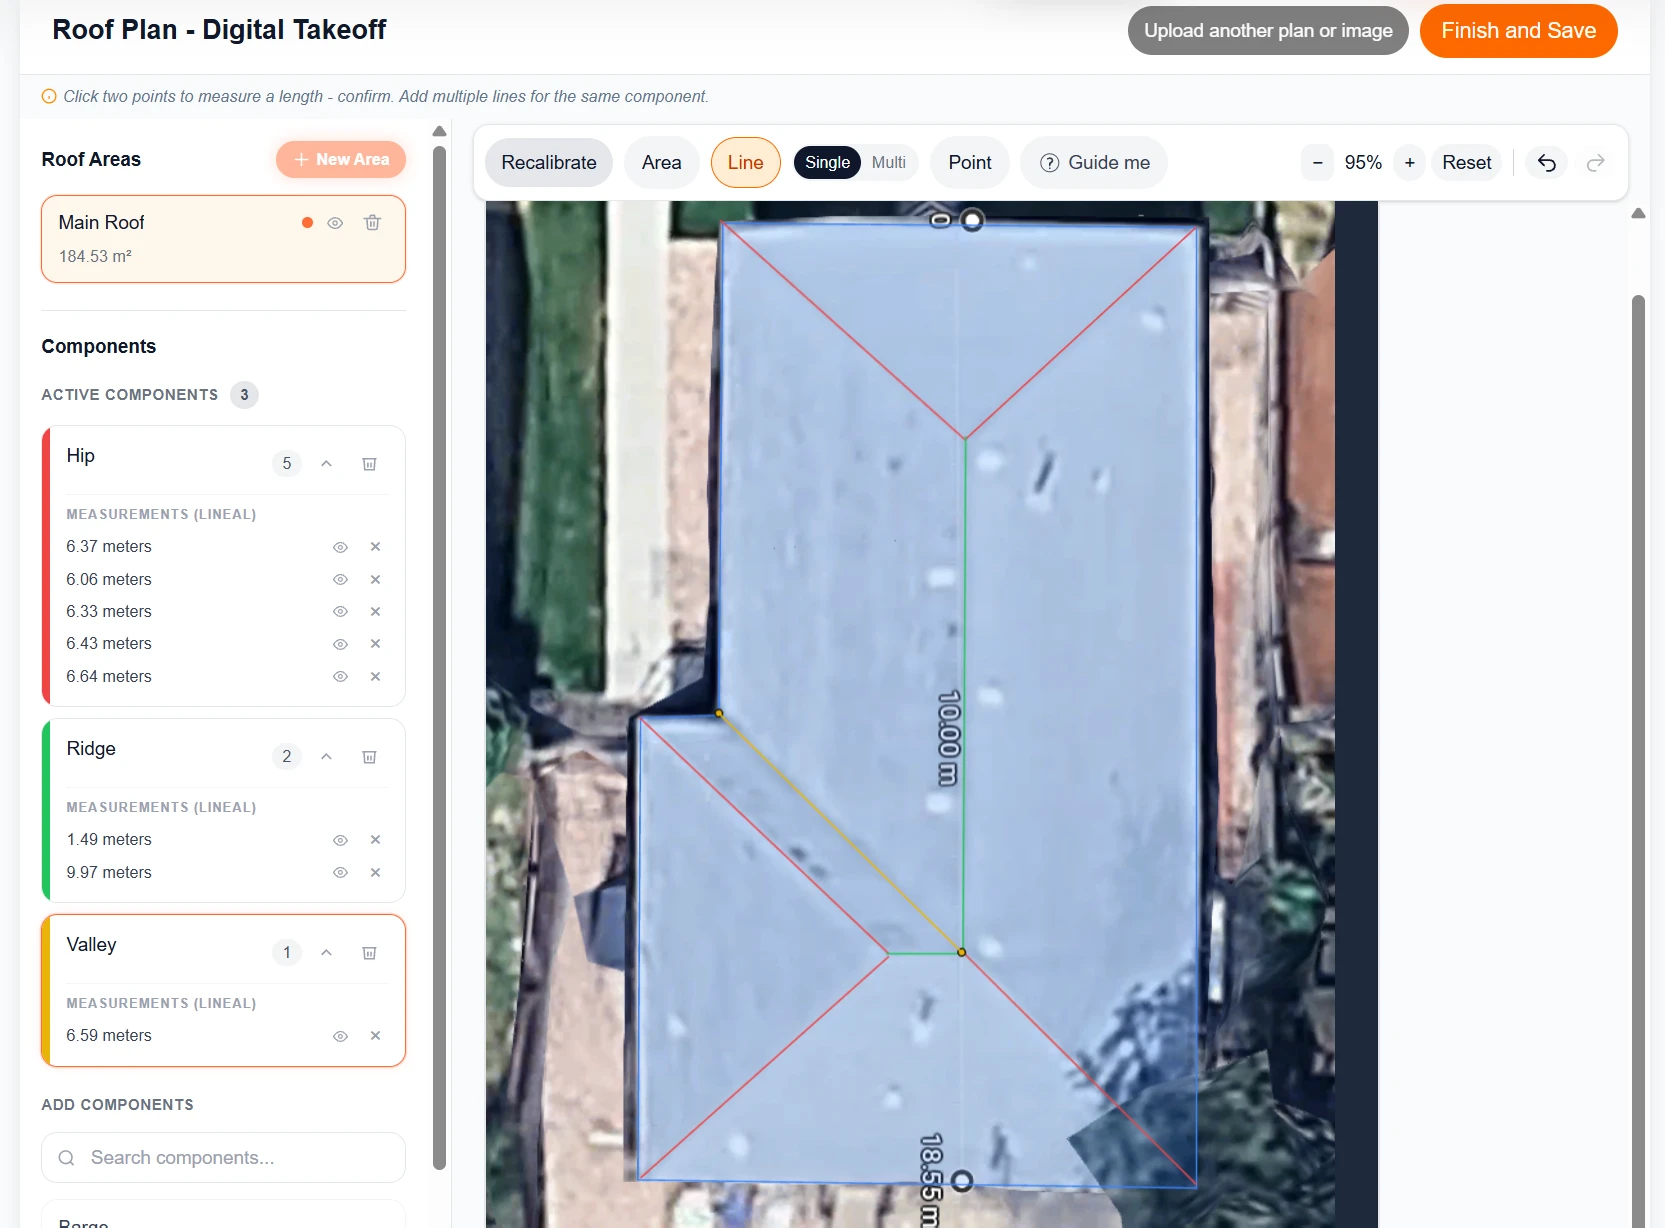
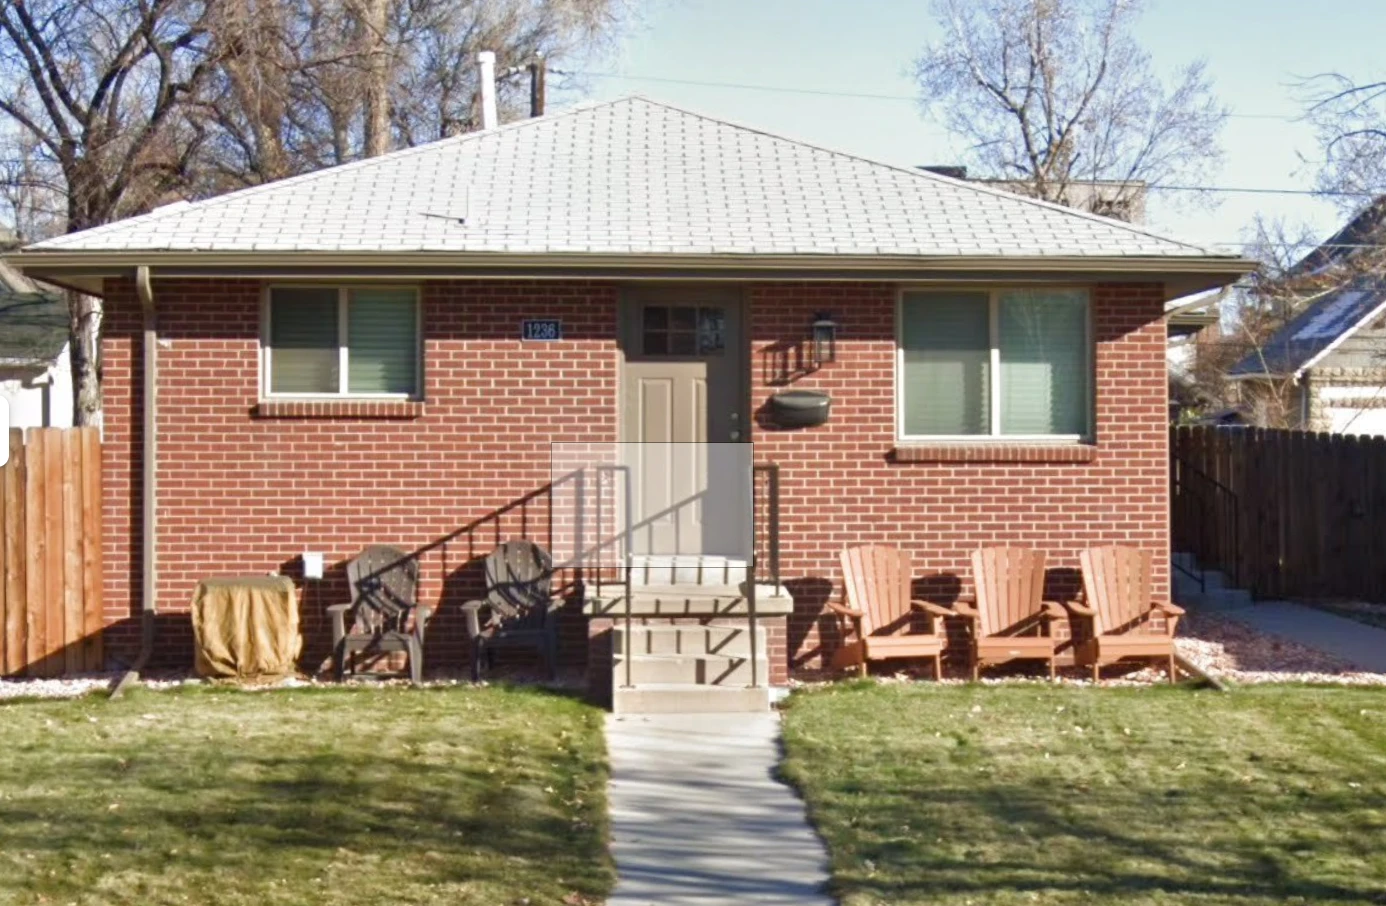
| Component | Entry | Digital | Physical | Difference | Abs. error |
|---|---|---|---|---|---|
| Roof Area | - | 191.04 m² | 196.2 m² | - | 2.63% |
| Ridge | 1 | 1.49 m | 1.50 m | -0.01 m | 0.7% |
| Ridge | 2 | 9.97 m | 10 m | -0.03 m | 0.3% |
| Hip | 1 | 6.49 m | 6.30 m | 0.19 m | 3.0% |
| Hip | 2 | 6.16 m | 6.30 m | -0.14 m | 2.2% |
| Hip | 3 | 6.44 m | 6.50 m | -0.06 m | 0.9% |
| Hip | 4 | 6.54 m | 6.50 m | 0.04 m | 0.6% |
| Hip | 5 | 6.76 m | 6.80 m | -0.04 m | 0.6% |
| Valley | 1 | 6.70 m | 6.60 m | 0.10 m | 1.5% |
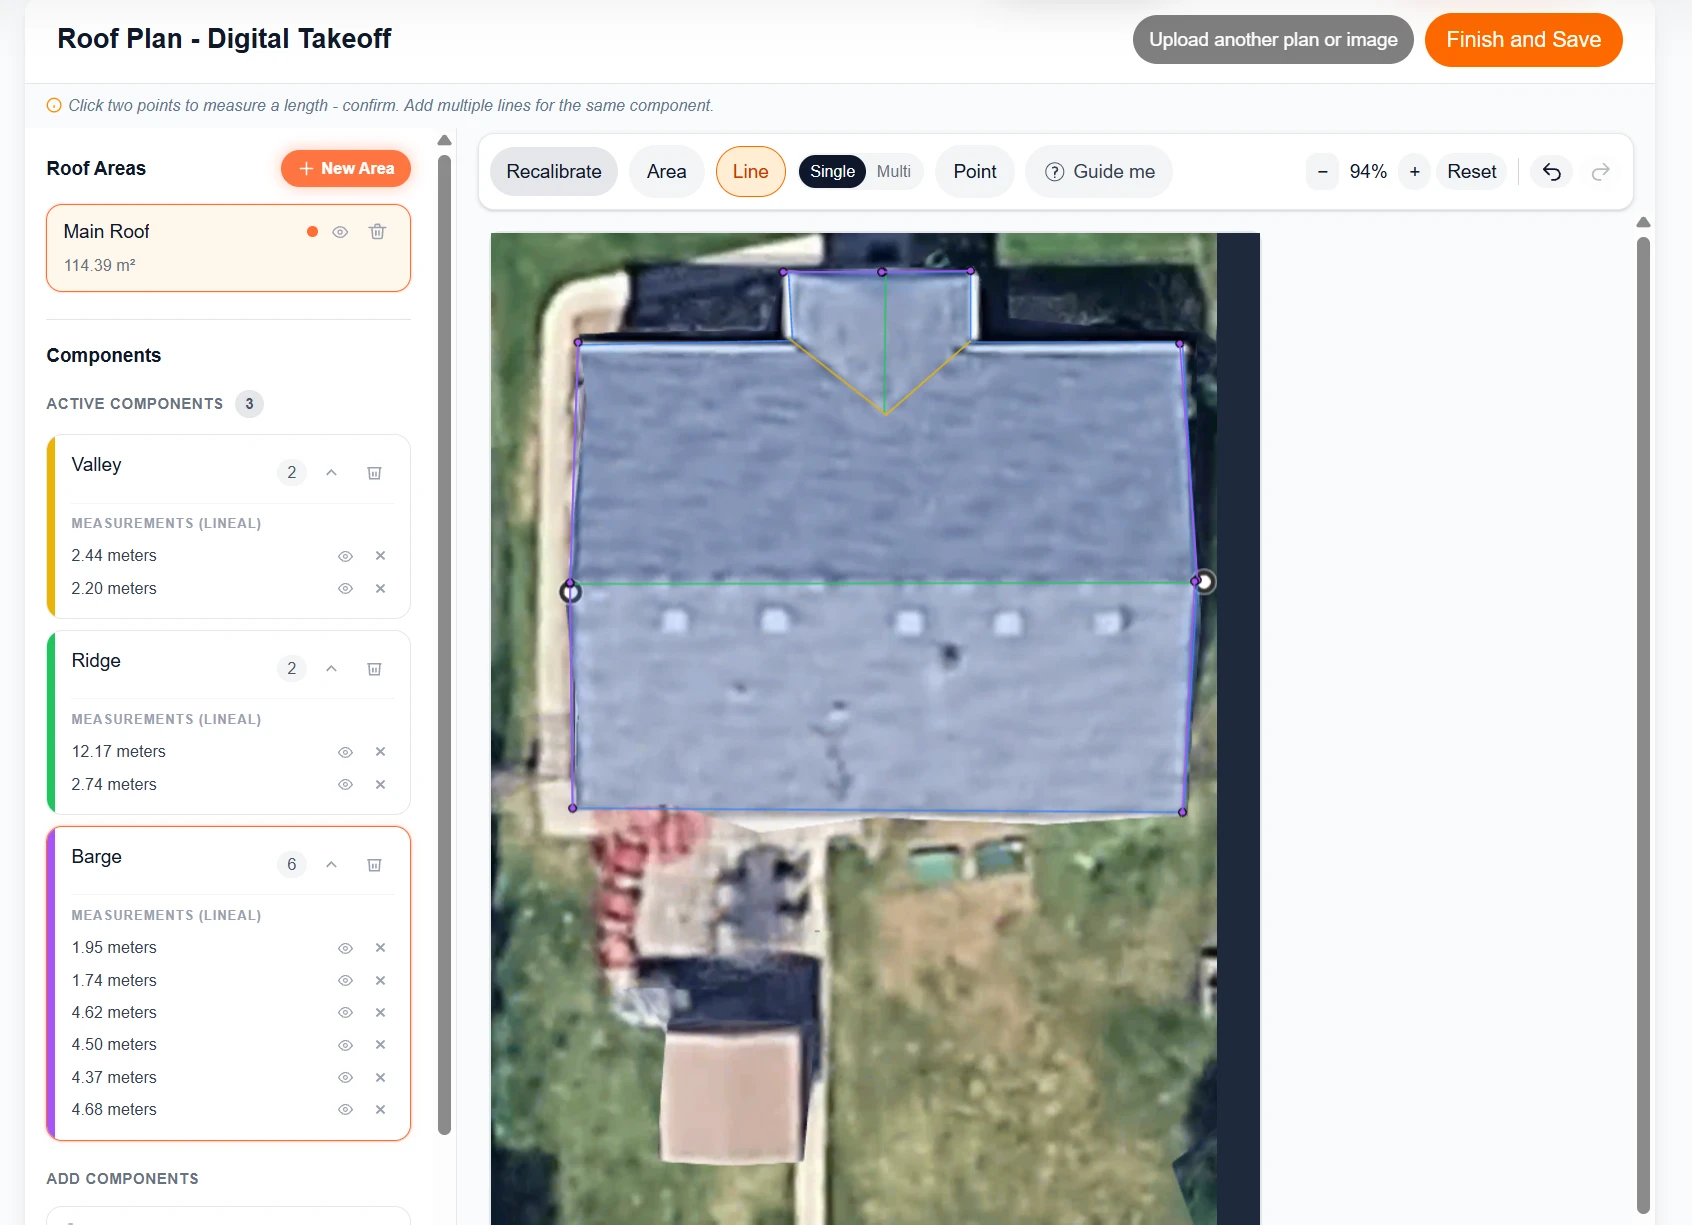
| Component | Entry | Digital | Physical | Difference | Abs. error |
|---|---|---|---|---|---|
| Roof Area | - | 123.82 m² | 118.4 m² | - | 4.58% |
| Ridge | 1 | 12.17 m | 12.10 m | 0.07 m | 0.6% |
| Ridge | 2 | 2.74 m | 2.80 m | -0.06 m | 2.1% |
| Valley | 1 | 2.54 m | 2.30 m | 0.24 m | 10.4% |
| Valley | 2 | 2.29 m | 2.30 m | -0.01 m | 0.4% |
| Barge | 1 | 2.11 m | 2 m | 0.11 m | 5.5% |
| Barge | 2 | 1.88 m | 2 m | -0.12 m | 6.0% |
| Barge | 3 | 5 m | 5 m | 0 m | 0.0% |
| Barge | 4 | 4.87 m | 5 m | -0.13 m | 2.6% |
| Barge | 5 | 4.73 m | 5 m | -0.27 m | 5.4% |
| Barge | 6 | 5.07 m | 5 m | 0.07 m | 1.4% |
| Component | Entry | Digital | Physical | Difference | Abs. error |
|---|---|---|---|---|---|
| Roof Area | - | 267.73 m² | 272.9 m² | - | 1.89% |
| Ridge | 1 | 4.62 m | 4.70 m | -0.08 m | 1.7% |
| Ridge | 2 | 7.54 m | 7.60 m | -0.06 m | 0.8% |
| Ridge | 3 | 5.81 m | 5.80 m | 0.01 m | 0.2% |
| Ridge | 4 | 2.41 m | 2.50 m | -0.09 m | 3.6% |
| Hip | 1 | 4.89 m | 5 m | -0.11 m | 2.2% |
| Hip | 2 | 6.88 m | 6.90 m | -0.02 m | 0.3% |
| Hip | 3 | 9.84 m | 10 m | -0.16 m | 1.6% |
| Hip | 4 | 3.35 m | 3.40 m | -0.05 m | 1.5% |
| Valley | 1 | 4.91 m | 5 m | -0.09 m | 1.8% |
| Valley | 2 | 5.09 m | 5 m | 0.09 m | 1.8% |
| Valley | 3 | 5.21 m | 5 m | 0.21 m | 4.2% |
| Barge | 1 | 3.48 m | 3.50 m | -0.02 m | 0.6% |
| Barge | 2 | 3.60 m | 3.50 m | 0.10 m | 2.9% |
| Barge | 3 | 5.94 m | 6 m | -0.06 m | 1.0% |
| Barge | 4 | 2.98 m | 3 m | -0.02 m | 0.7% |
| Barge | 5 | 4.46 m | 4.30 m | 0.16 m | 3.7% |
| Barge | 6 | 4.07 m | 4.30 m | -0.23 m | 5.3% |
| Component | Entry | Digital | Physical | Difference | Abs. error |
|---|---|---|---|---|---|
| Roof Area | - | 173.4 m² | 168.8 m² | - | 2.73% |
| Ridge | 1 | 3.38 m | 3.50 m | -0.12 m | 3.4% |
| Ridge | 2 | 5.11 m | 5 m | 0.11 m | 2.2% |
| Hip | 1 | 7.49 m | 7.50 m | -0.01 m | 0.1% |
| Hip | 2 | 7.42 m | 7.50 m | -0.08 m | 1.1% |
| Hip | 3 | 7.18 m | 7.50 m | -0.32 m | 4.3% |
| Hip | 4 | 7.15 m | 7.50 m | -0.35 m | 4.7% |
| Valley | 1 | 2.45 m | 2.30 m | 0.15 m | 6.5% |
| Valley | 2 | 2.19 m | 2.30 m | -0.11 m | 4.8% |
| Barge | 1 | 2.84 m | 3.10 m | -0.26 m | 8.4% |
| Barge | 2 | 3.43 m | 3.10 m | 0.33 m | 10.6% |
| Component | Entry | Digital | Physical | Difference | Abs. error |
|---|---|---|---|---|---|
| Roof Area | - | 195.04 m² | 202.2 m² | - | 3.54% |
| Ridge | 1 | 2.56 m | 2.60 m | -0.04 m | 1.5% |
| Ridge | 2 | 5.01 m | 5 m | 0.01 m | 0.2% |
| Ridge | 3 | 3.40 m | 3.50 m | -0.10 m | 2.9% |
| Hip | 1 | 7.53 m | 7.50 m | 0.03 m | 0.4% |
| Hip | 2 | 7.40 m | 7.50 m | -0.10 m | 1.3% |
| Hip | 3 | 1.04 m | 1.10 m | -0.06 m | 5.5% |
| Hip | 4 | 7.93 m | 7.40 m | 0.53 m | 7.2% |
| Hip | 5 | 7.05 m | 7.40 m | -0.35 m | 4.7% |
| Hip | 6 | 1.51 m | 1.40 m | 0.11 m | 7.9% |
| Valley | 1 | 5.23 m | 5.30 m | -0.07 m | 1.3% |
| Valley | 2 | 7.34 m | 7.20 m | 0.14 m | 1.9% |
| Barge | 1 | 4.27 m | 4.20 m | 0.07 m | 1.7% |
| Barge | 2 | 4.03 m | 4.20 m | -0.17 m | 4.0% |
9 of 10 roof areas were within 5% of the physical measurement. All 10 were within 10%. Average absolute roof-area error was 3.52%.
Across 136 ridge, hip, valley, barge and spouting measurements, 83.8% were within 5% and 94.9% were within 10%. Median absolute component error was 1.94%.
Pitch estimates averaged 1.6° from the real pitch, with all 10 roofs within 3° in this test.
Digital takeoffs required 71.1% less measuring time (27:09 vs 94:06 across the 10 roofs), before travel was included.
The largest errors came from geometry that could not be clearly identified in the source imagery, rather than simply from roofs with more components.
Yes. Google Earth was deliberately used because it is widely accessible and free. It is not always the newest or highest-resolution imagery available. Commercial aerial measurement services can use higher-resolution imagery, elevation data, LiDAR, photogrammetry or human review and may produce tighter results.
If a job requires contract-grade measurement, difficult hidden geometry, insurance documentation or material ordering with very little tolerance, a paid report or physical verification may be the better choice.
Google itself describes Earth measurement results as estimates rather than substitutes for on-site or survey-grade measurement, which is why this study compared the remote results against real physical measurements.
This study asks a different question: how close can a roofer get using a free image source, a manual takeoff they control, and no per-report measurement fee?
| Option | Published position | Cost model | QuoteCore+ angle |
|---|---|---|---|
| Google Earth measurement tools | Google supports distance/area measurement and states results are estimates; standard length/area measurements do not account for elevation | Free | QuoteCore can use the image as a calibrated takeoff base, add roof pitch, individual roof components, custom quantities/pricing and continue into a quote |
| QuoteCore+ + free aerial imagery | Manual user-controlled takeoff; this study: 3.52% avg area error across 10 roofs | Free basic workflow | Every visible component can be traced; optional custom materials, labour, waste and pricing; measurement can continue into quote |
| GAF QuickMeasure | GAF says reports are generally about 95% accurate; residential reports under an hour | About $18-$20/report (single-family residential) | QuoteCore route can be tested repeatedly without purchasing reports |
| EagleView Premium Roof Report | Independent CompassData benchmark published >98% accuracy for area/lines/slope | From about $24.25/report | QuoteCore is the zero-cost DIY option where that level of precision is not required |
| Roofr Reports | Paid satellite reports delivered in roughly two hours; DIY measurement options also exist; paid ecosystem continues into proposals/material workflows | From about $13/report on paid plans | No measurement-report fee or account is required to start the basic free takeoff workflow |
| Roof Aim | Claims 1.4% avg error across 50 Florida roofs | 30-day trial, then $29/month | QuoteCore basic takeoff remains free and user-controlled |
These products do not all use the same imagery, measurement method or reporting methodology. This is a workflow and cost comparison, not a direct accuracy leaderboard.
Competitor pricing and published claims checked: September 2026.
A satellite or Google Earth roof measurement normally leaves you with dimensions that still need to be transferred into a spreadsheet, roofing calculator, estimating system or quoting app. QuoteCore+ is designed to turn roof measurements into materials, labour and pricing, continuing from the measurement itself into quantities, waste, pricing and a customer quote.
QuoteCore+'s free takeoff workflow can continue from the roof drawing into quantities and pricing. The 10 study takeoffs used the seven default free components, but users can also create up to seven custom components for the session and attach their own material, labour, waste and pricing logic.
Once the takeoff is complete, the result can continue into a customer quote. Paid QuoteCore+ plans are primarily about saving and reusing that setup - permanent component libraries, saved pricing, jobs, quotes, orders, invoices, sending, tracking and follow-ups.
Before you drive to your next reroof just to measure it, try the same process we used in this study. Find the property remotely, complete the takeoff for free, save your numbers, then compare them with what you find on site.
Watch the full walkthrough: free roof takeoff from Google Maps to quote
Free · no card · no measurement-report fee
The complete dataset for all 10 roofs - every roof area, pitch, component measurement, error and note - is published as a CSV.
Download CSV dataset (v1.0)Suggested citation: QuoteCore+ (2026), How Accurate Is Measuring a Roof With Google Earth? We Tested 10 Real Roofs, QuoteCore+ Original Research, September 2026. https://quote-core.com/research/google-earth-roof-measurement-accuracy
This study was conducted internally by QuoteCore+ using QuoteCore+'s own free takeoff tools. It has not been independently audited. We publish the methodology, all ten roof-level results, individual measurement data and known failure cases so readers can assess the evidence themselves. Google Earth and Street View are trademarks of Google LLC. QuoteCore+ is not affiliated with or endorsed by Google.
In this QuoteCore+ study of 10 accessible residential roofs, remote Google Earth/aerial roof takeoffs averaged 3.52% absolute roof-area error compared with physical site measurements. 9 of 10 roof areas were within 5% and all 10 were within 10%. Across 136 individual ridge, hip, valley, barge and spouting measurements, 83.8% were within 5% and 94.9% were within 10%. Accuracy will vary with image quality, calibration, pitch and whether the complete roof can actually be seen.
Yes. Use freely available aerial imagery as your base, calibrate the scale, and trace the roof manually in QuoteCore+'s free takeoff tool. Accuracy depends on imagery resolution, how recent the imagery is, and whether all roof geometry is actually visible.
Google Earth top-down imagery alone does not establish pitch. In this study, pitch was estimated from Street View/side imagery using QuoteCore+'s Pitch Finder, averaging 1.6° absolute error across the 10 roofs, with every estimate within 3°.
For estimating, quoting and early pricing, yes - 9 of 10 roof areas in this study were within 5%. For material ordering with tight tolerance, insurance documentation, or roofs with hidden geometry (see NZ-01 above), verify on site or use a paid report.
Image resolution, imprecise scale calibration, perspective, hidden geometry (upper roofs, soffits, parapets), tree cover, outdated imagery, and roof sections covered by overlapping structures. In this study, visibility - not roof complexity - drove the largest errors.
Often, potentially yes. Commercial services use higher-resolution imagery, 3D data, LiDAR or human review and may produce tighter results. This study asks how close a roofer can get with free imagery and a manual takeoff they control.
Yes - and it's quick. When the takeoff is finished, one button converts it into a professional quote. You have two options along the way: use the seven default free components, which calculate all your pitch-adjusted measurements now and let you add pricing later, or create up to seven custom components that already carry your own material, labour, waste and pricing figures. Either way, it's a couple of clicks from measurements to a customer-ready quote. Paid plans add permanent saved libraries, jobs, quotes, orders and invoices.
The same basic manual workflow can work with any sufficiently clear top-down image that can be calibrated to a known scale or dimension. This 10-roof study used Google Earth/aerial imagery and Street View/side imagery, so the published accuracy figures are for that tested workflow rather than a separate Google Maps test. If your Google Maps satellite view is clearer and can be calibrated accurately, it can still be used as an image source in QuoteCore+'s free takeoff tool.
Yes. That is one of the most practical uses of a remote takeoff: measuring an existing roof for early estimating or quoting before committing time to a site measure. The workflow is especially useful when the roof geometry is visible in the imagery. Critical dimensions should still be physically verified where the image is unclear or where exact ordering tolerance is required.
A roof measurement or roof takeoff/take-off determines the roof areas and component lengths - for example ridges, hips, valleys, eaves, gutters/spouting and barges/verges. A roof estimate or quote then applies materials, labour, waste, pricing and scope to those quantities. QuoteCore+ can carry the same measured takeoff into the pricing and quoting stage rather than requiring the measurements to be re-entered elsewhere.
Yes. QuoteCore+'s free roof takeoff supports metres and m², feet and ft², and roofing squares. One roofing square equals 100 square feet. Pitch can be entered in degrees or, for imperial/roofing-square workflows, as a rise:run ratio such as 6:12. See also QuoteCore+'s free roofing squares calculator.
Yes, provided suitable imagery is available. The physical validation in this study was performed in New Zealand and the United States, so the published accuracy figures should not be treated as a separate UK, Australian or Canadian benchmark. The underlying takeoff workflow is location-independent and supports both metric and imperial units.